


Will Solana Spark a Bull Run or Sink Even Lower?
- Solana is trading within the $140 range.
- SOL’s daily trading volume has surged by over 48%.
The crypto assets are attempting a recovery, with the market cap reaching $2.75 trillion, with fear hanging over the market. Major assets have failed to exhibit steady momentum amid the uncertainty. Meanwhile, Solana (SOL) has posted a modest gain of 1.28%.
Solana could recover from the bearish grip only after a series of resistance tests. In the early hours, the asset traded at around $135.77, and the modest bullish pressure has triggered SOL to jump toward $142.66.
At press time, Solana traded within the $140.80 range, with the daily trading volume increasing by over 48.96%, reaching $3.36 billion. Furthermore, the Solana market has witnessed a 24-hour liquidation of $9.66 million, as per Coinglass.
Notably, Ali’s chart shows that Solana may face a short-term pullback. A sell signal has appeared on the 12-hour chart by the TD Sequential indicator. This could mean that a pullback is likely after the recent upward momentum.
Will Solana Flip the Script and Turn Bullish?
The four-hour price graph of Solana hints that a continued downtrend forms a death cross. It could make the price slip toward the support zone at $134.20. Falling past this mark might pave the way for a deeper slide to the crucial $128 range.
Contrarily, if SOL mounts to $146.14, the price could potentially eye its subsequent resistance at around the $151.25 level. Upon breaking this resistance, the altcoin might trigger the golden cross to emerge for more upside correction.
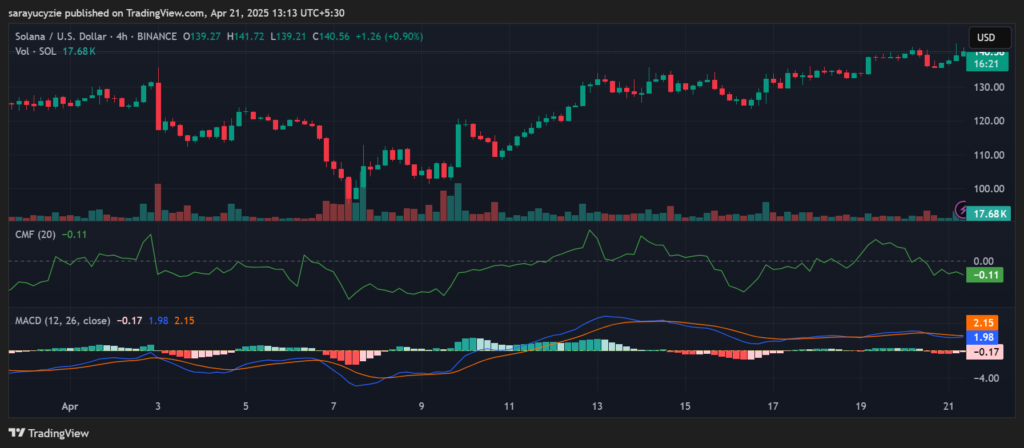
SOL’s Moving Average Convergence Divergence (MACD) line has fallen below the signal line. This indicates a crossover of bears, with the chance of a continued downtrend. Besides, the Chaikin Money Flow (CMF) indicator at -0.11 suggests outflows and moderate selling pressure.
The asset’s daily relative strength index (RSI) is positioned at 63.34, inferring a bullish wave approaching the overbought territory. Solana’s Bull Bear Power (BBP) value of 5.03 signals the positive momentum in the market, pushing the price high.
Read More

Spotlight on XRP, Solana as 72 Crypto ETFs Seek SEC Approval This Year
Solana Jumps Over 48% Volume as Trump Calls For Fed Chair Termination
Will Solana Spark a Bull Run or Sink Even Lower?
- Solana is trading within the $140 range.
- SOL’s daily trading volume has surged by over 48%.
The crypto assets are attempting a recovery, with the market cap reaching $2.75 trillion, with fear hanging over the market. Major assets have failed to exhibit steady momentum amid the uncertainty. Meanwhile, Solana (SOL) has posted a modest gain of 1.28%.
Solana could recover from the bearish grip only after a series of resistance tests. In the early hours, the asset traded at around $135.77, and the modest bullish pressure has triggered SOL to jump toward $142.66.
At press time, Solana traded within the $140.80 range, with the daily trading volume increasing by over 48.96%, reaching $3.36 billion. Furthermore, the Solana market has witnessed a 24-hour liquidation of $9.66 million, as per Coinglass.
Notably, Ali’s chart shows that Solana may face a short-term pullback. A sell signal has appeared on the 12-hour chart by the TD Sequential indicator. This could mean that a pullback is likely after the recent upward momentum.
Will Solana Flip the Script and Turn Bullish?
The four-hour price graph of Solana hints that a continued downtrend forms a death cross. It could make the price slip toward the support zone at $134.20. Falling past this mark might pave the way for a deeper slide to the crucial $128 range.
Contrarily, if SOL mounts to $146.14, the price could potentially eye its subsequent resistance at around the $151.25 level. Upon breaking this resistance, the altcoin might trigger the golden cross to emerge for more upside correction.
SOL’s Moving Average Convergence Divergence (MACD) line has fallen below the signal line. This indicates a crossover of bears, with the chance of a continued downtrend. Besides, the Chaikin Money Flow (CMF) indicator at -0.11 suggests outflows and moderate selling pressure.
The asset’s daily relative strength index (RSI) is positioned at 63.34, inferring a bullish wave approaching the overbought territory. Solana’s Bull Bear Power (BBP) value of 5.03 signals the positive momentum in the market, pushing the price high.
Read More
Spotlight on XRP, Solana as 72 Crypto ETFs Seek SEC Approval This Year