Ethereum Attempts Breakout From Multi-Month Downtrend, But Can ETH Hold $1,600?

Amid the latest market recovery, Ethereum (ETH) attempted to break out from its multi-month downtrend, leading some market watchers to suggest that a new rally could start soon. However, as price struggles to hold the $1,600 level as support, the cryptocurrency risks losing recent momentum.
Ethereum Breakout Eyes Key Resistance
On Easter Sunday, the crypto market saw a positive end-of-week after jumping 4.2%. Bitcoin (BTC) closed the week above the $85,000 barrier for the first time this month, while Ethereum surged 5.4% to attempt to reclaim the $1,600 resistance for the third time in the past seven days.
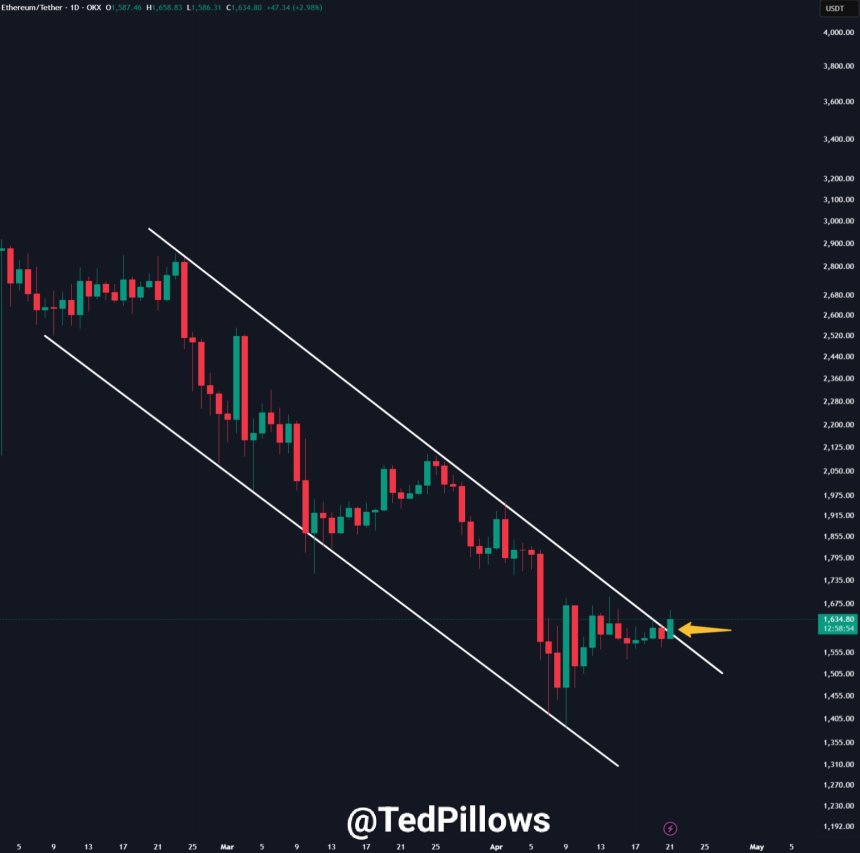
ETH closed the week around the $1,640 mark before climbing to $1,658 during Monday’s early hours. Amid this performance, the cryptocurrency attempted to break out of its multi-month downtrend for the first time.
Crypto analyst Ted Pillows highlighted that Ethereum broke out of its descending resistance on Monday morning. According to the post, the cryptocurrency has been in a downtrend in the one-day chart since early February, retesting the trendline thrice over the past few months, but always being rejected.

Its latest rejection from the descending resistance sent the cryptocurrency below the $1,700 mark, which fueled the bearish sentiment brewing toward ETH. The start-of-April retraces, driven by the ongoing tariff war between the US and China, further sent Ethereum to lower levels, hitting its two-year low below $1,400 and retesting the 2018 highs.
The analyst noted that ETH could rally toward $2,000 during April’s last leg if the cryptocurrency holds the $1,600 support, which it hasn’t been able to do for most of the month.
Is The ETH Bottom Close?
Analyst Carl Runefelt also highlighted ETH’s downtrend breakout, affirming that it “might go absolutely parabolic starting from here.” According to Runefelt, the resistance breakout eyes the $3,000 mark, which was lost during the February retraces.
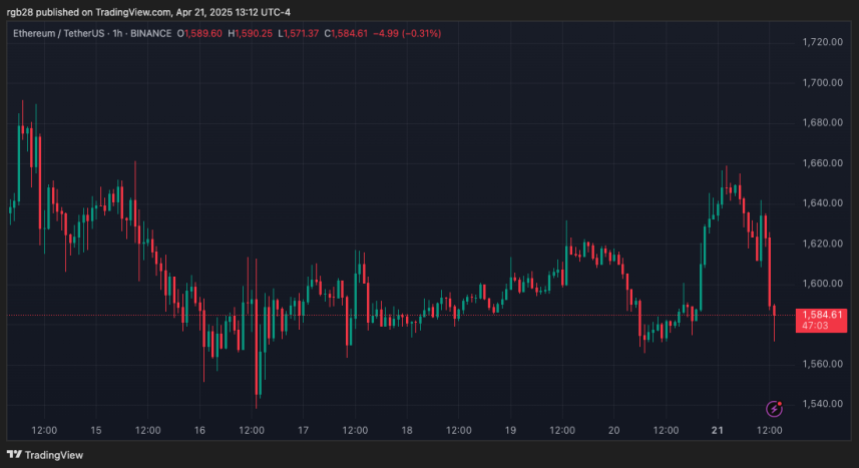
However, Ethereum has lost its short-term momentum, retracing its 24-hour gains in the past few hours. Its price dropped below the $1,600 mark into the key $1,500 support level, trading around the $1,570-$1,580 price range.
This retracement could hint that ETH’s recovery failed to gain strength, risking a drop to the current level’s lows. However, a bounce from this zone to hold the $1,650 mark could confirm the breakout and propel the cryptocurrency’s price toward $1,700-$1,800 resistance.
Analyst Ali Martinez considers that ETH’s new rally won’t start again until it breaks through the $2,330 supply wall, where over 12.6 million addresses purchased around 68-63 million ETH.
Meanwhile, another market watcher suggested that Ethereum’s trading pair against Bitcoin is “the only chart to look at right now.” Crypto Fella affirmed that the bottom of the ETH/BTC chart is close, as it has reached its lowest level since 2020.
Per the chart, the last time ETH/BTC dropped below the 0.022 mark, it hovered between the 0.016-0.022 zone for some months before bouncing toward its late-2021 high.
As of this writing, Ethereum trades at $1,571, a 1% decline in the daily timeframe.

Ethereum Attempts Breakout From Multi-Month Downtrend, But Can ETH Hold $1,600?

Amid the latest market recovery, Ethereum (ETH) attempted to break out from its multi-month downtrend, leading some market watchers to suggest that a new rally could start soon. However, as price struggles to hold the $1,600 level as support, the cryptocurrency risks losing recent momentum.
Ethereum Breakout Eyes Key Resistance
On Easter Sunday, the crypto market saw a positive end-of-week after jumping 4.2%. Bitcoin (BTC) closed the week above the $85,000 barrier for the first time this month, while Ethereum surged 5.4% to attempt to reclaim the $1,600 resistance for the third time in the past seven days.
ETH closed the week around the $1,640 mark before climbing to $1,658 during Monday’s early hours. Amid this performance, the cryptocurrency attempted to break out of its multi-month downtrend for the first time.
Crypto analyst Ted Pillows highlighted that Ethereum broke out of its descending resistance on Monday morning. According to the post, the cryptocurrency has been in a downtrend in the one-day chart since early February, retesting the trendline thrice over the past few months, but always being rejected.

Its latest rejection from the descending resistance sent the cryptocurrency below the $1,700 mark, which fueled the bearish sentiment brewing toward ETH. The start-of-April retraces, driven by the ongoing tariff war between the US and China, further sent Ethereum to lower levels, hitting its two-year low below $1,400 and retesting the 2018 highs.
The analyst noted that ETH could rally toward $2,000 during April’s last leg if the cryptocurrency holds the $1,600 support, which it hasn’t been able to do for most of the month.
Is The ETH Bottom Close?
Analyst Carl Runefelt also highlighted ETH’s downtrend breakout, affirming that it “might go absolutely parabolic starting from here.” According to Runefelt, the resistance breakout eyes the $3,000 mark, which was lost during the February retraces.
However, Ethereum has lost its short-term momentum, retracing its 24-hour gains in the past few hours. Its price dropped below the $1,600 mark into the key $1,500 support level, trading around the $1,570-$1,580 price range.
This retracement could hint that ETH’s recovery failed to gain strength, risking a drop to the current level’s lows. However, a bounce from this zone to hold the $1,650 mark could confirm the breakout and propel the cryptocurrency’s price toward $1,700-$1,800 resistance.
Analyst Ali Martinez considers that ETH’s new rally won’t start again until it breaks through the $2,330 supply wall, where over 12.6 million addresses purchased around 68-63 million ETH.
Meanwhile, another market watcher suggested that Ethereum’s trading pair against Bitcoin is “the only chart to look at right now.” Crypto Fella affirmed that the bottom of the ETH/BTC chart is close, as it has reached its lowest level since 2020.
Per the chart, the last time ETH/BTC dropped below the 0.022 mark, it hovered between the 0.016-0.022 zone for some months before bouncing toward its late-2021 high.
As of this writing, Ethereum trades at $1,571, a 1% decline in the daily timeframe.


