


Ethereum Price Rebound Stalls—Can It Reclaim the Lost Support?

Ethereum price failed to recover above $1,700 and dropped below $1,550. ETH is now correcting losses and might face resistance near the $1,620 zone.
- Ethereum failed to stay above the $1,620 and $1,550 levels.
- The price is trading below $1,620 and the 100-hourly Simple Moving Average.
- There is a connecting bearish trend line forming with resistance at $1,615 on the hourly chart of ETH/USD (data feed via Kraken).
- The pair remains at risk of more losses if it fails to clear the $1,620 resistance zone.
Ethereum Price Recovery Faces Resistance
Ethereum price failed to stay above the $1,700 support zone and extended losses, like Bitcoin. ETH declined heavily below the $1,650 and $1,620 levels.
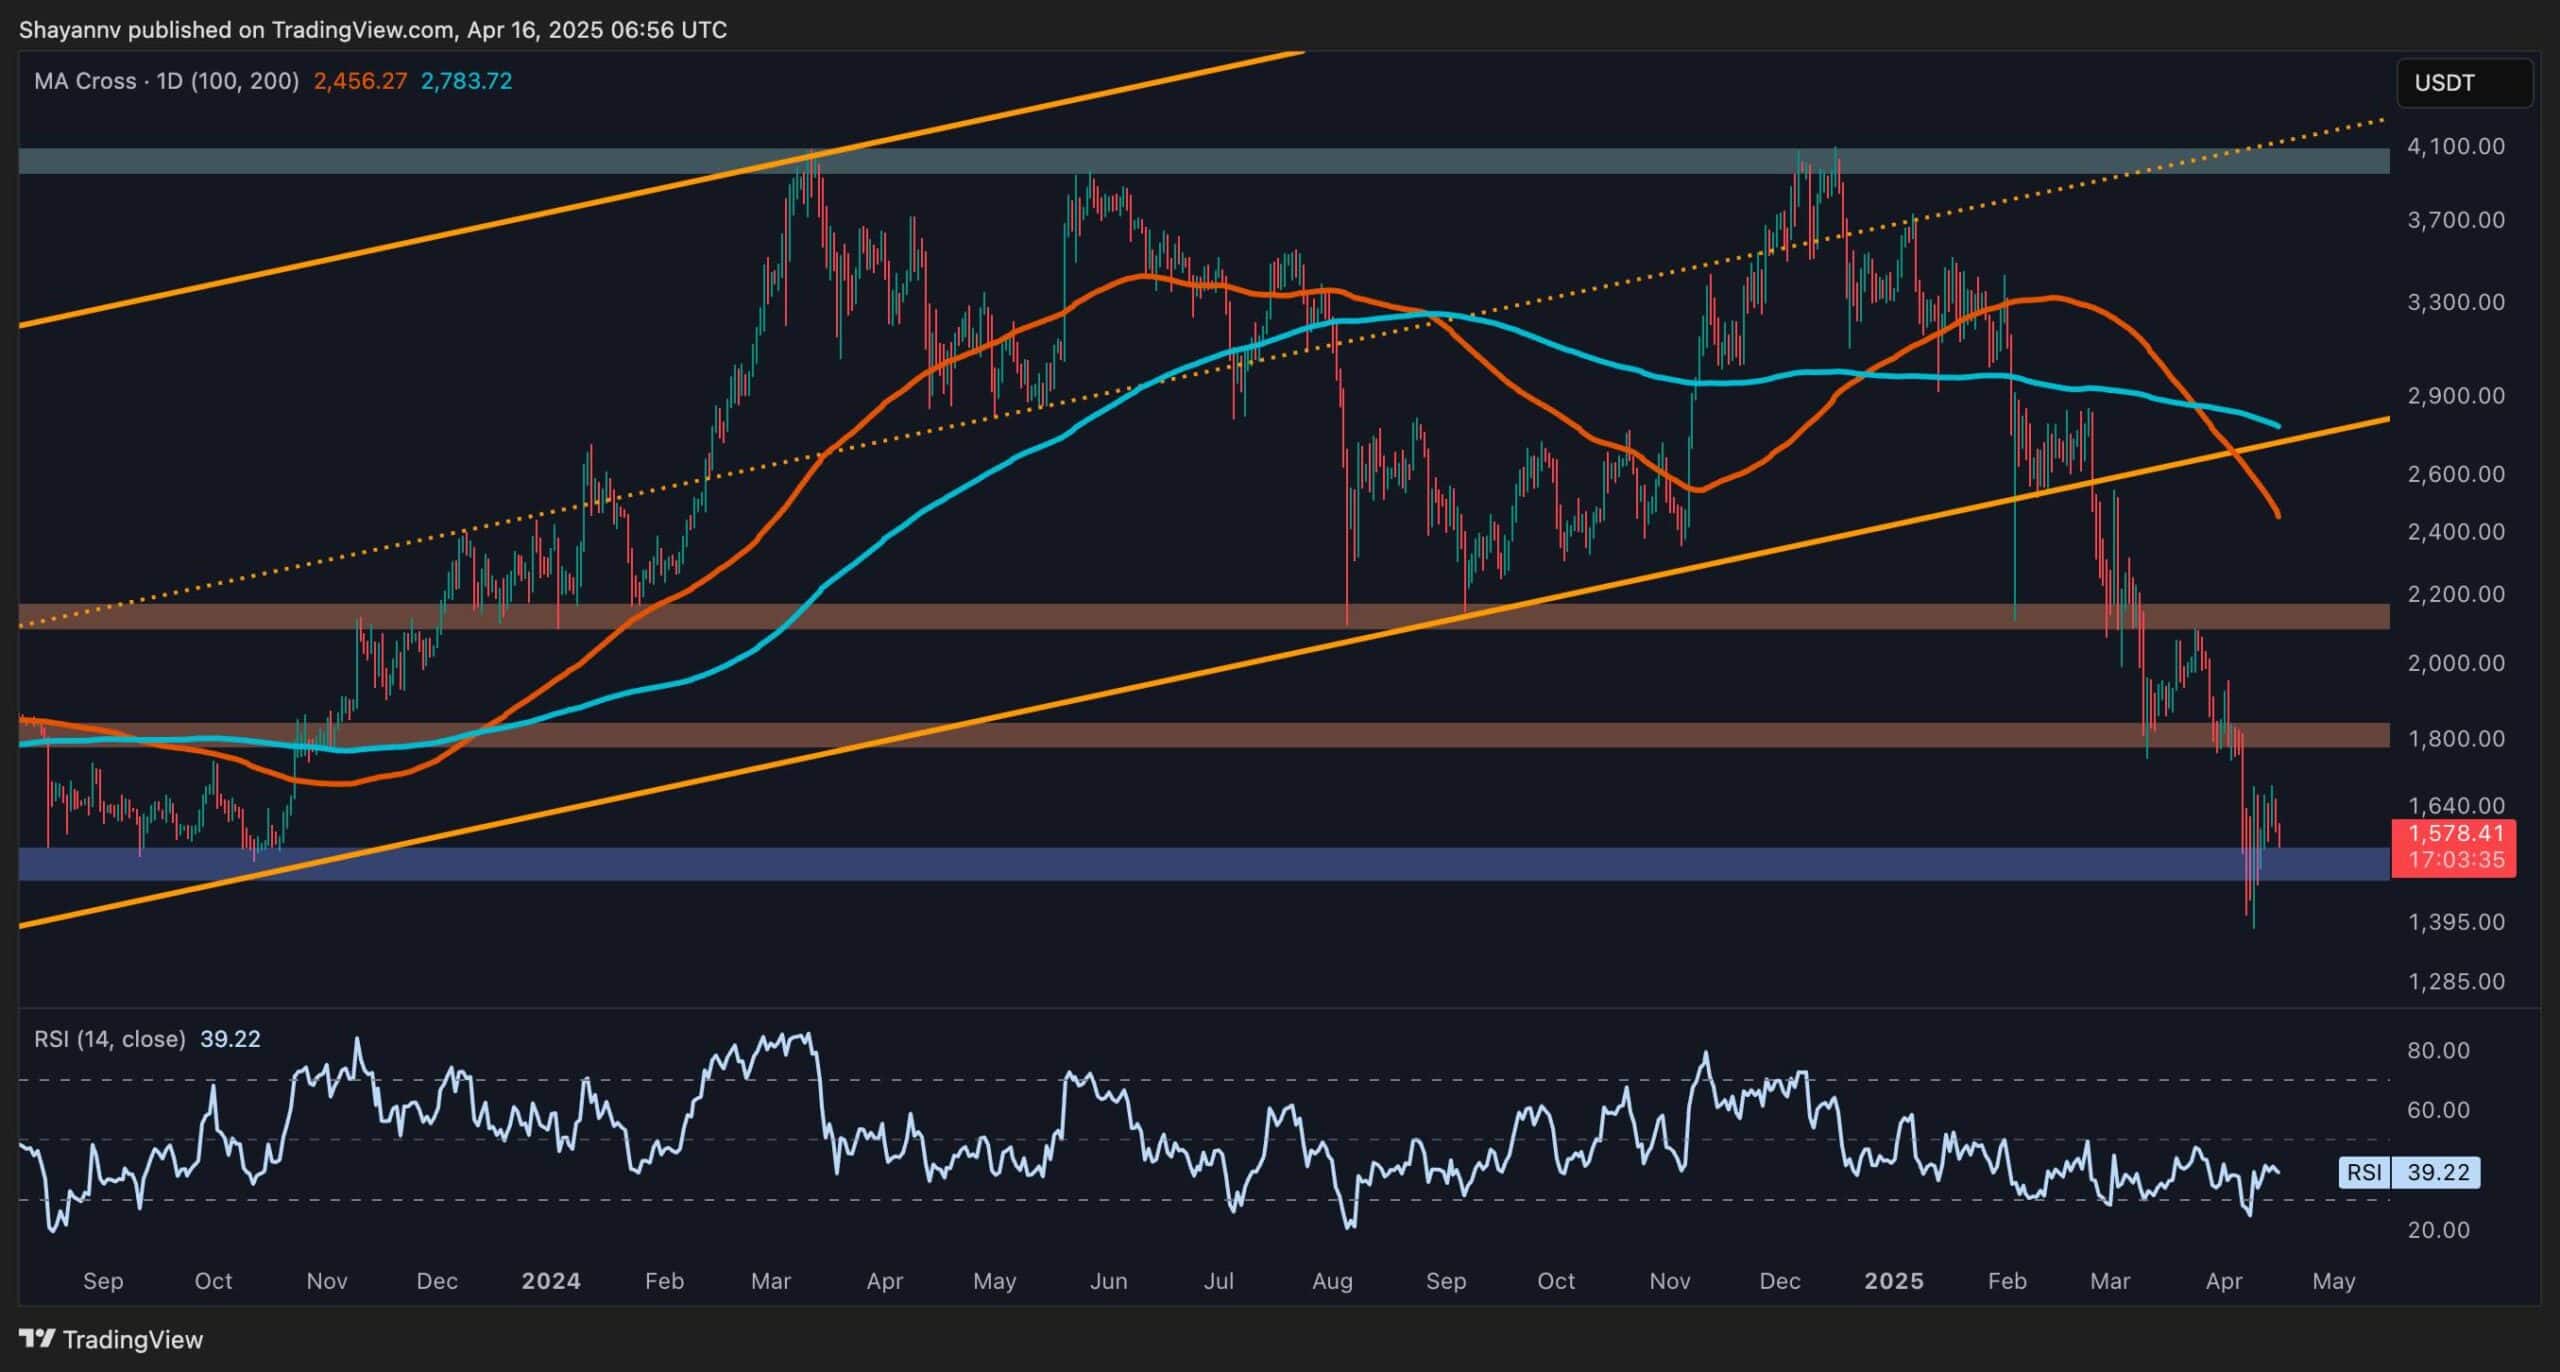
The bears even pushed the price below the $1,550 level. A low was formed at $1,410 and the price recently corrected some losses. There was a move above the $1,550 level. The price climbed above the 23.6% Fib retracement level of the downward move from the $1,815 swing high to the $1,410 low.
However, the bears are active near the $1,620 zone. Ethereum price is now trading below $1,620 and the 100-hourly Simple Moving Average. On the upside, the price seems to be facing hurdles near the $1,615 level.
There is also a connecting bearish trend line forming with resistance at $1,615 on the hourly chart of ETH/USD. It is close to the 50% Fib retracement level of the downward move from the $1,815 swing high to the $1,410 low. The next key resistance is near the $1,660 level.

The first major resistance is near the $1,720 level. A clear move above the $1,720 resistance might send the price toward the $1,820 resistance. An upside break above the $1,820 resistance might call for more gains in the coming sessions. In the stated case, Ether could rise toward the $1,880 resistance zone or even $1,920 in the near term.
Another Decline In ETH?
If Ethereum fails to clear the $1,620 resistance, it could start another decline. Initial support on the downside is near the $1,540 level. The first major support sits near the $1,505 zone.
A clear move below the $1,505 support might push the price toward the $1,420 support. Any more losses might send the price toward the $1,380 support level in the near term. The next key support sits at $1,320.
Technical Indicators
Hourly MACD – The MACD for ETH/USD is losing momentum in the bullish zone.
Hourly RSI – The RSI for ETH/USD is now above the 50 zone.
Major Support Level – $1,540
Major Resistance Level – $1,620
Read More
Ethereum Price Analysis: Losing This Support Could Mean Drop to $1.1K

Ethereum Price Rebound Stalls—Can It Reclaim the Lost Support?
Ethereum price failed to recover above $1,700 and dropped below $1,550. ETH is now correcting losses and might face resistance near the $1,620 zone.
- Ethereum failed to stay above the $1,620 and $1,550 levels.
- The price is trading below $1,620 and the 100-hourly Simple Moving Average.
- There is a connecting bearish trend line forming with resistance at $1,615 on the hourly chart of ETH/USD (data feed via Kraken).
- The pair remains at risk of more losses if it fails to clear the $1,620 resistance zone.
Ethereum Price Recovery Faces Resistance
Ethereum price failed to stay above the $1,700 support zone and extended losses, like Bitcoin. ETH declined heavily below the $1,650 and $1,620 levels.
The bears even pushed the price below the $1,550 level. A low was formed at $1,410 and the price recently corrected some losses. There was a move above the $1,550 level. The price climbed above the 23.6% Fib retracement level of the downward move from the $1,815 swing high to the $1,410 low.
However, the bears are active near the $1,620 zone. Ethereum price is now trading below $1,620 and the 100-hourly Simple Moving Average. On the upside, the price seems to be facing hurdles near the $1,615 level.
There is also a connecting bearish trend line forming with resistance at $1,615 on the hourly chart of ETH/USD. It is close to the 50% Fib retracement level of the downward move from the $1,815 swing high to the $1,410 low. The next key resistance is near the $1,660 level.
The first major resistance is near the $1,720 level. A clear move above the $1,720 resistance might send the price toward the $1,820 resistance. An upside break above the $1,820 resistance might call for more gains in the coming sessions. In the stated case, Ether could rise toward the $1,880 resistance zone or even $1,920 in the near term.
Another Decline In ETH?
If Ethereum fails to clear the $1,620 resistance, it could start another decline. Initial support on the downside is near the $1,540 level. The first major support sits near the $1,505 zone.
A clear move below the $1,505 support might push the price toward the $1,420 support. Any more losses might send the price toward the $1,380 support level in the near term. The next key support sits at $1,320.
Technical Indicators
Hourly MACD – The MACD for ETH/USD is losing momentum in the bullish zone.
Hourly RSI – The RSI for ETH/USD is now above the 50 zone.
Major Support Level – $1,540
Major Resistance Level – $1,620
Read More