


Bitcoin To Top Above $168,500 Based On This Indicator, Analyst Reveals

An analyst has explained how Bitcoin could see a top beyond the $168,500 mark based on the historical trend in this indicator.
Bitcoin Mayer Multiple Could Reveal Location Of Next Price Top
In a new post on X, analyst Ali Martinez has discussed where the BTC top could lie based on the Mayer Multiple. The “Mayer Multiple” refers to an indicator that keeps track of the ratio between the Bitcoin price and its 200-day moving average (MA).
The 200-day MA has historically proven to be a significant level for BTC, often serving as the boundary between bearish and bullish trends. As such, the distance of the price from this MA, which is what the Mayer Multiple measures, can be useful to watch.
When the Mayer Multiple has a high value, it means the asset is trading significantly above the 200-day MA, which could imply potential overbought conditions. On the other hand, the metric being low could suggest a bullish reversal may be due for BTC.
Now, here is the chart shared by Martinez that shows the trend in the Bitcoin Mayer Multiple represented as an oscillator over the history of the cryptocurrency:
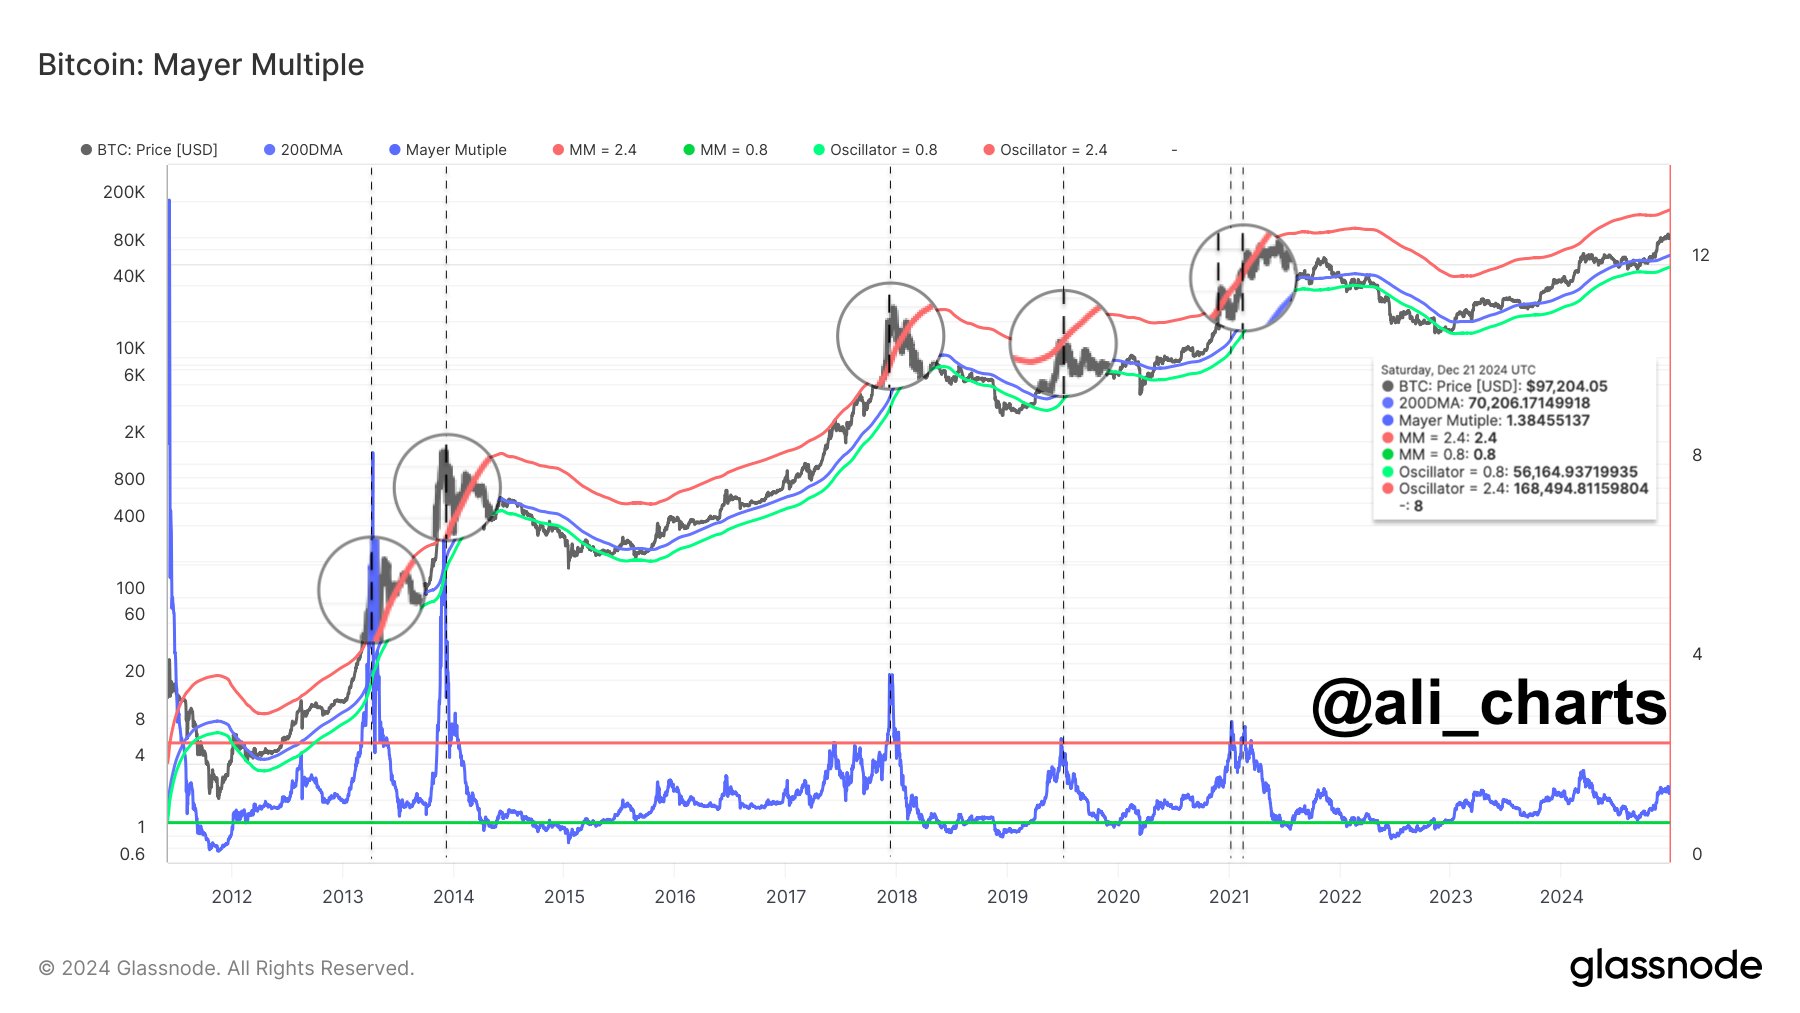
As is visible in the above graph, the Bitcoin Mayer Multiple is currently around halfway to the level that has usually signaled overheated conditions for the coin’s price.
The level in question is situated at the 2.4 mark. When the metric assumes this value, the price of the asset becomes 2.4 times the 200-day MA. In the same chart, a price line corresponding to this level is also shown.
It’s apparent that Bitcoin formed some of its major historical tops when it broke through the line. So far in the current cycle, Bitcoin hasn’t been able to retest the level yet.
And it may not be able to do so for a while, either since the Mayer Multiple would only equal 2.4 when the cryptocurrency’s price rises to around the $168,500 level.
An important level relevant to the Mayer Multiple that BTC did retest during this cycle was the 0.8 line. Just like the 2.4 level serves as a signal for potential overheated conditions, this line can imply the coin may be reaching a bottom.
Bitcoin successfully found a rebound at the line earlier in the year, confirming that a transition towards a bear market hadn’t taken place yet. It now remains to be seen whether the asset would go on to retest the top level next or if another plunge to this bottom level will happen first.
BTC Price
Bitcoin slipped toward the $92,000 level on Friday, but it seems the asset has made some recovery since then, as it sits at $96,000 to kick off the new week.
Read More

CZ Was Appointed As Advisor Just Three Days Ago! The First Bitcoin (BTC) Move Came From That Country!

Bitcoin To Top Above $168,500 Based On This Indicator, Analyst Reveals
An analyst has explained how Bitcoin could see a top beyond the $168,500 mark based on the historical trend in this indicator.
Bitcoin Mayer Multiple Could Reveal Location Of Next Price Top
In a new post on X, analyst Ali Martinez has discussed where the BTC top could lie based on the Mayer Multiple. The “Mayer Multiple” refers to an indicator that keeps track of the ratio between the Bitcoin price and its 200-day moving average (MA).
The 200-day MA has historically proven to be a significant level for BTC, often serving as the boundary between bearish and bullish trends. As such, the distance of the price from this MA, which is what the Mayer Multiple measures, can be useful to watch.
When the Mayer Multiple has a high value, it means the asset is trading significantly above the 200-day MA, which could imply potential overbought conditions. On the other hand, the metric being low could suggest a bullish reversal may be due for BTC.
Now, here is the chart shared by Martinez that shows the trend in the Bitcoin Mayer Multiple represented as an oscillator over the history of the cryptocurrency:
As is visible in the above graph, the Bitcoin Mayer Multiple is currently around halfway to the level that has usually signaled overheated conditions for the coin’s price.
The level in question is situated at the 2.4 mark. When the metric assumes this value, the price of the asset becomes 2.4 times the 200-day MA. In the same chart, a price line corresponding to this level is also shown.
It’s apparent that Bitcoin formed some of its major historical tops when it broke through the line. So far in the current cycle, Bitcoin hasn’t been able to retest the level yet.
And it may not be able to do so for a while, either since the Mayer Multiple would only equal 2.4 when the cryptocurrency’s price rises to around the $168,500 level.
An important level relevant to the Mayer Multiple that BTC did retest during this cycle was the 0.8 line. Just like the 2.4 level serves as a signal for potential overheated conditions, this line can imply the coin may be reaching a bottom.
Bitcoin successfully found a rebound at the line earlier in the year, confirming that a transition towards a bear market hadn’t taken place yet. It now remains to be seen whether the asset would go on to retest the top level next or if another plunge to this bottom level will happen first.
BTC Price
Bitcoin slipped toward the $92,000 level on Friday, but it seems the asset has made some recovery since then, as it sits at $96,000 to kick off the new week.
Read More