


Bitcoin Price Prediction: The Last Leg-Up That Confirms A Resounding Rally To $150,000

A new Bitcoin price prediction suggests that the flagship cryptocurrency needs just one more leg up to kickstart a powerful bullish move toward $150,000 and beyond. With Bitcoin getting ready to once again hit new all-time highs, technical formations suggest that this projected rally could be the final confirmation of a long-term breakout.
Bitcoin Price Roadmap To $150,000 ATH
A new Bitcoin price analysis released by market expert CrediBull Crypto on X (formerly Twitter) predicts that BTC is gearing up for a massive surge to $150,000. The analyst shared a Bitcoin price chart, using Elliott Wave theory on the lower time frames to break down the roadmap to this new all-time high target.
Bitcoin is currently forming a 5-wave impulse move on the lower timeframe. The recent price action suggests that it has completed sub-waves i, ii, iii, iv, and v, collectively forming what appears to be Wave 1. Following this, the cryptocurrency experienced a collective pullback in Wave 2, which acted as support and now serves as a launchpad for the next major leg in Wave 3—the longest and most explosive wave in an impulse sequence.
If the next wave completes to the upside, it would strongly suggest that Bitcoin is not in a corrective pattern but rather an impulsive trend that could take it to a six-figure valuation once again.
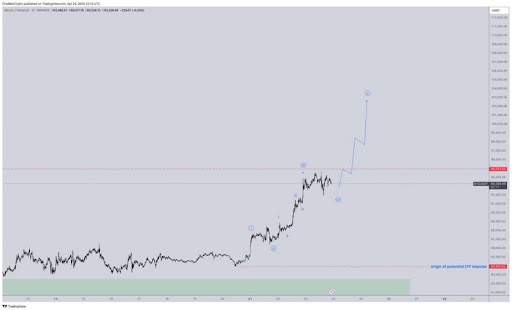
CrediBull Crypto has highlighted $89,000 as a critical level for Bitcoin. He suggested that if the cryptocurrency drops below this price zone before pushing higher, the Elliott Wave structure would likely morph into a 3-legged corrective pattern rather than a 5-wave impulse. This move would imply that the projected rally is not the start of a macro breakout, and the market may have to wait longer for a confirmation.
On the other hand, holding above $89,000 and printing a higher high would complete the anticipated final leg up, validating the start of the large Wave 3 on higher time frames. This bullish scenario would support a strong accumulation strategy, where price declines could become opportunities to buy as Bitcoin targets $150,000 or more.
MVRV Golden Cross Signals BTC Bull Rally
Bitcoin’s Market Value to Realized Value (MVRV) ratio has formed a Golden Cross with its 365-day Simple Moving Average (SMA), according to fresh data shared by crypto analyst Ali Martínez. The analyst has shared an optimistic outlook for Bitcoin, highlighting that this technical event could spark the next BTC bull rally.
The Bitcoin chart, published via CryptoQuant, highlights the MVRV ratio surging above the long-term Moving Average. A rising MVRV ratio typically suggests that BTC holders are once again in profit, and sentiment is shifting from bearish to bullish. The last time this crossover occurred, Bitcoin saw a multi-month rally that pushed its price to new all-time highs.
Read More

How To Price Bitcoin? BlackRock Exec Explains

Bitcoin Trades At 40% Discount As ‘Triple Put’ Unfolds: Hedge Fund Founder
Bitcoin Price Prediction: The Last Leg-Up That Confirms A Resounding Rally To $150,000
A new Bitcoin price prediction suggests that the flagship cryptocurrency needs just one more leg up to kickstart a powerful bullish move toward $150,000 and beyond. With Bitcoin getting ready to once again hit new all-time highs, technical formations suggest that this projected rally could be the final confirmation of a long-term breakout.
Bitcoin Price Roadmap To $150,000 ATH
A new Bitcoin price analysis released by market expert CrediBull Crypto on X (formerly Twitter) predicts that BTC is gearing up for a massive surge to $150,000. The analyst shared a Bitcoin price chart, using Elliott Wave theory on the lower time frames to break down the roadmap to this new all-time high target.
Bitcoin is currently forming a 5-wave impulse move on the lower timeframe. The recent price action suggests that it has completed sub-waves i, ii, iii, iv, and v, collectively forming what appears to be Wave 1. Following this, the cryptocurrency experienced a collective pullback in Wave 2, which acted as support and now serves as a launchpad for the next major leg in Wave 3—the longest and most explosive wave in an impulse sequence.
If the next wave completes to the upside, it would strongly suggest that Bitcoin is not in a corrective pattern but rather an impulsive trend that could take it to a six-figure valuation once again.
CrediBull Crypto has highlighted $89,000 as a critical level for Bitcoin. He suggested that if the cryptocurrency drops below this price zone before pushing higher, the Elliott Wave structure would likely morph into a 3-legged corrective pattern rather than a 5-wave impulse. This move would imply that the projected rally is not the start of a macro breakout, and the market may have to wait longer for a confirmation.
On the other hand, holding above $89,000 and printing a higher high would complete the anticipated final leg up, validating the start of the large Wave 3 on higher time frames. This bullish scenario would support a strong accumulation strategy, where price declines could become opportunities to buy as Bitcoin targets $150,000 or more.
MVRV Golden Cross Signals BTC Bull Rally
Bitcoin’s Market Value to Realized Value (MVRV) ratio has formed a Golden Cross with its 365-day Simple Moving Average (SMA), according to fresh data shared by crypto analyst Ali Martínez. The analyst has shared an optimistic outlook for Bitcoin, highlighting that this technical event could spark the next BTC bull rally.
The Bitcoin chart, published via CryptoQuant, highlights the MVRV ratio surging above the long-term Moving Average. A rising MVRV ratio typically suggests that BTC holders are once again in profit, and sentiment is shifting from bearish to bullish. The last time this crossover occurred, Bitcoin saw a multi-month rally that pushed its price to new all-time highs.
Read More
How To Price Bitcoin? BlackRock Exec Explains