


SUI Price Jumps Over 20%, Is the Bearish Trend Over?

- SUI price rebounds over 20% in the past 24-H from a low of $1.74, hitting an intraday high of $2.10.
- SUI remains in a broader downtrend, facing resistance near $2.20–$2.50.
After a sharp dip that reminded many of the infamous 1987 Wall Street crash, the global crypto market started the new trading day with a modest recovery. Industry watchers even dubbed it “Black Monday 2.0” as several digital assets plunged dramatically. But today brought some green, with the overall market rising 3.20% to hit a $2.53 trillion market cap.
Interestingly, meme coin FARTCOIN and the trending token Hperliquid (HYPE) took the spotlight among top gainers, posting impressive jumps of 31% and 22% respectively.
One of the standout performers today is Sui (SUI), which surged over 22% from a low of $1.74 to an intraday high of $2.10. Just a day earlier, SUI had dropped nearly 20%, marking its lowest point since October 2024. The recovery now sees SUI trading around $2.06 — a 10.12% gain in the last 24 hours — with a market cap of $6.71 billion. Its daily trading volume also spiked by 75.78%, reaching $1.95 billion.
MACD and CMF Indicators Signals Mixed Momentum for SUI Price
On the charts, the 4-hour SUI/USDT pair shows a bullish engulfing pattern, signaling a potential short-term trend reversal from the recent downtrend. After several red candles, a strong green candle has formed, fully engulfing the previous candle — a classic bullish signal. Buyers defended the $1.73 support zone strongly which leading to today’s rally.
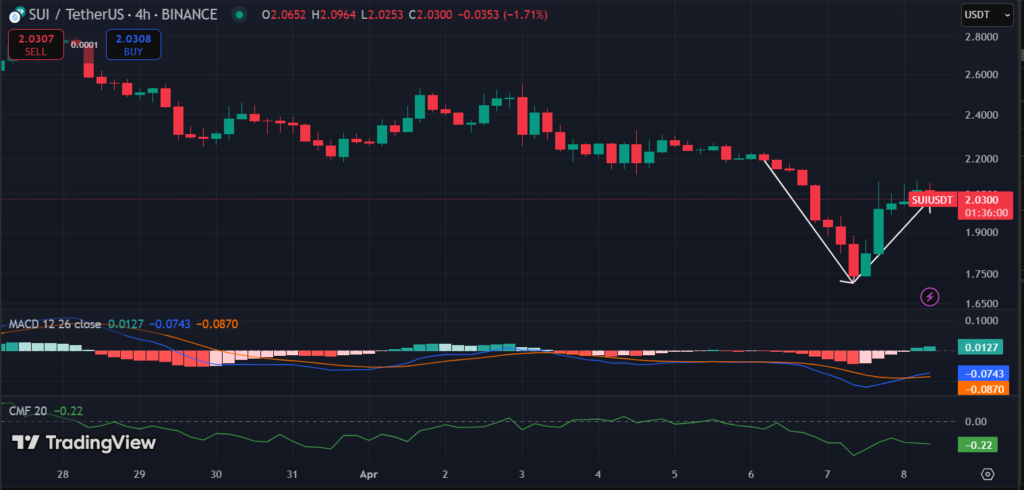
The MACD line (blue) is still below the signal line (orange), indicating lingering positive momentum. Also, the histogram bars are shrinking, suggesting weakening selling pressure and a potential bullish crossover for SUI. The CMF remains slightly negative, but a move into positive territory could confirm strong buying activity.
However, the daily chart paints a more cautious picture. A Head and Shoulders pattern — typically a bearish signal — is still visible. The broader trend since late February has been bearish with a pattern of lower highs and lower lows. Unless SUI convincingly breaks above $2.20 and eventually $2.50, the broader downtrend could continue.

In conclusion, while the 4-hour chart shows encouraging signs of a short-term bounce the daily structure remains fragile. Bears have dominated recently and although a bounce has occurred, it’s not yet strong enough to shift the larger trend. The Head and Shoulders breakdown remains a warning signal that cannot be ignored. For deeper insights into where SUI could be headed, check out our Sui (SUI) Price Prediction 2025, 2026-2030.
| Aspect | Daily Chart (1D) | 4-Hour Chart (4H) |
| Pattern | Bearish Head & Shoulders | Bullish Engulfing |
| Trend | Downtrend (Macro) | Short-term recovery |
| MACD | Bearish (below zero) | Bullish crossover |
| CMF | Slightly negative | Deep negative (-0.22) |
| Price Action | Bounce from $1.73 but still under pressure | Strong bounce from bottom |
| Momentum Outlook | Bearish-to-neutral | Bullish (short-term) |
Highlighted Crypto News Today:
Why is Curve Finance Founder Offloading CRV Amid Token and Market Recovery?
Read More

Pay with Pi? Hundreds of Businesses Now Saying ‘Yes’ (Korea & Florida Lead)
SUI Price Jumps Over 20%, Is the Bearish Trend Over?
- SUI price rebounds over 20% in the past 24-H from a low of $1.74, hitting an intraday high of $2.10.
- SUI remains in a broader downtrend, facing resistance near $2.20–$2.50.
After a sharp dip that reminded many of the infamous 1987 Wall Street crash, the global crypto market started the new trading day with a modest recovery. Industry watchers even dubbed it “Black Monday 2.0” as several digital assets plunged dramatically. But today brought some green, with the overall market rising 3.20% to hit a $2.53 trillion market cap.
Interestingly, meme coin FARTCOIN and the trending token Hperliquid (HYPE) took the spotlight among top gainers, posting impressive jumps of 31% and 22% respectively.
One of the standout performers today is Sui (SUI), which surged over 22% from a low of $1.74 to an intraday high of $2.10. Just a day earlier, SUI had dropped nearly 20%, marking its lowest point since October 2024. The recovery now sees SUI trading around $2.06 — a 10.12% gain in the last 24 hours — with a market cap of $6.71 billion. Its daily trading volume also spiked by 75.78%, reaching $1.95 billion.
MACD and CMF Indicators Signals Mixed Momentum for SUI Price
On the charts, the 4-hour SUI/USDT pair shows a bullish engulfing pattern, signaling a potential short-term trend reversal from the recent downtrend. After several red candles, a strong green candle has formed, fully engulfing the previous candle — a classic bullish signal. Buyers defended the $1.73 support zone strongly which leading to today’s rally.
The MACD line (blue) is still below the signal line (orange), indicating lingering positive momentum. Also, the histogram bars are shrinking, suggesting weakening selling pressure and a potential bullish crossover for SUI. The CMF remains slightly negative, but a move into positive territory could confirm strong buying activity.
However, the daily chart paints a more cautious picture. A Head and Shoulders pattern — typically a bearish signal — is still visible. The broader trend since late February has been bearish with a pattern of lower highs and lower lows. Unless SUI convincingly breaks above $2.20 and eventually $2.50, the broader downtrend could continue.
In conclusion, while the 4-hour chart shows encouraging signs of a short-term bounce the daily structure remains fragile. Bears have dominated recently and although a bounce has occurred, it’s not yet strong enough to shift the larger trend. The Head and Shoulders breakdown remains a warning signal that cannot be ignored. For deeper insights into where SUI could be headed, check out our Sui (SUI) Price Prediction 2025, 2026-2030.
| Aspect | Daily Chart (1D) | 4-Hour Chart (4H) |
| Pattern | Bearish Head & Shoulders | Bullish Engulfing |
| Trend | Downtrend (Macro) | Short-term recovery |
| MACD | Bearish (below zero) | Bullish crossover |
| CMF | Slightly negative | Deep negative (-0.22) |
| Price Action | Bounce from $1.73 but still under pressure | Strong bounce from bottom |
| Momentum Outlook | Bearish-to-neutral | Bullish (short-term) |
Highlighted Crypto News Today:
Why is Curve Finance Founder Offloading CRV Amid Token and Market Recovery?
Read More