XRP at $2.07—Will It Crash or Hit $3.78? Analyst Predicts Next Move!

The XRP price prediction has become a spicy topic right now as the crypto token hovers around the value of $2.07, with some traders and investors closely watching its next potential move. At the time of writing this piece, XRP is showing signs of a possible head-and-shoulders pattern. This could points towards either a bullish breakthrough or a significant downtrend ready to hit, depending on whether key support levels hold up.

Also Read: Dogecoin to Hit a New High? Analyst Says It’s Possible Despite Headlines
How Market Volatility and Ripple’s Technical Analysis Could Affect XRP’s Future Price

The cryptocurrency market latest batch of volatility has been particularly evident in XRP’s latest and greatest price ups and downs. Currently trading at around $2.03, XRP has experienced about a 4.66% decrease in the last 24 hours. This decline comes amid some expanding market uncertainty, with the total cryptocurrency market capitalization falling by 2.20% to $2.68 trillion.
Head-and-Shoulders Pattern Points to Potential Downturn
Don't shoot the messenger.
— Peter Brandt (@PeterLBrandt) March 28, 2025
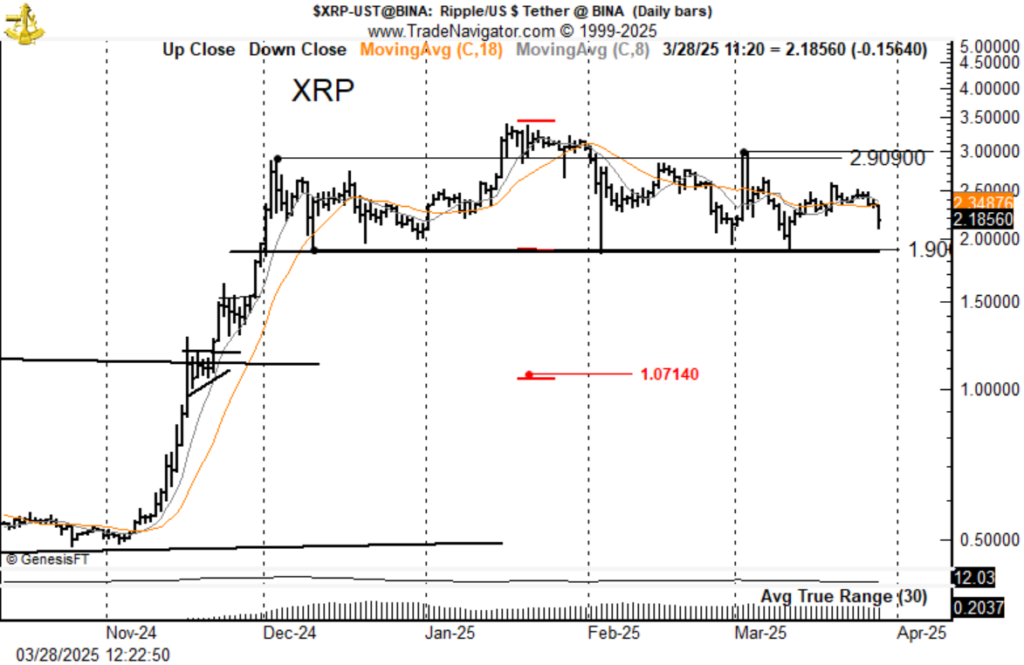
Your favorite Beanie Baby/Pet Rock crypto displays a classic complex H&S top. This could become bullish if 3.0 is exceeded, otherwise the implications is a decline to 1.07. If you have an issue with this, take it up with Magee and Edwards $XRP pic.twitter.com/nHaIgn8uP4
According to veteran analyst and trader Peter Brandt, XRP is exhibiting a classic head-and-shoulders topping pattern that could signal trouble ahead.
“XRP bears chalk out a H&S pattern,” says Brandt. “This could become bullish if 3.0 is exceeded, otherwise the implications is a decline to 1.07.”
The head-and-shoulders pattern appearing right now is made of three chart peaks, with the middle one (the “head“) being at the highest level, while the two outer peaks (the “shoulders“) are somewhat lower. A breakdown below the pattern’s neckline around the $1.90-$2.00 range could also trigger some significant sell-offs.
Technical Indicators Show Mixed Signals

XRP’s technical indicators are currently painting a somewhat bearish picture. The cryptocurrency’s 50-day Simple Moving Average (SMA) stands at $2.38, while its 14-day Relative Strength Index (RSI) is at 43.27, indicating neutral momentum that could shift in either direction.
Also Read: Pi Network: PI Coin Price Prediction For Mid-April 2025
Price Targets: Bullish vs. Bearish Scenarios

Despite the downtrend hitting it right now, some analysts remain optimistic about XRP’s future price. Per CoinCodex, XRP could actually reach $3.78 by April 28, 2025, representing a 76.42% increase in value from the current prices.
That said, if the head-and-shoulders pattern also plays out as Brandt and others suggest, XRP could be forced to deal with a substantial decline to around $1.07 in value. This bearish scenario would be triggered if XRP breaks below the critical support zone near $2.
“A breakdown could signal a shift from a bullish to a bearish trend, potentially halving the price to $1.07,” explains Omkar Godbole, a cryptocurrency market analyst. “Bulls need to push XRP above $3 to overcome the lower high set in early March.”
Market Factors Influencing XRP’s Price Movement

There are and will always be some several external factors are currently weighing on XRP’s performance. The “tariffs-led risk-off” environment has put pressure on payments-focused cryptocurrencies like XRP. Additionally, the broader market sentiment has been impacted by recent macroeconomic developments.
The cryptocurrency is also facing some resistance at around $3 in value, a level that also marked a lower high created in early March. For XRP to resume its upward trajectory, bulls would need to overcome this resistance level decisively.
Also Read: Dogecoin Price Reversal Ahead? Analyst Predicts 129% Surge to $0.39
Long-Term Outlook Remains Positive Despite Short-Term Concerns

Looking beyond the immediate technical analysis, long-term predictions for XRP remain relatively positive. By 2030, some forecasts suggest XRP could reach as high as $6.11, although this would involve navigating through several market cycles.
Despite some short-term bearish signals, XRP’s strong correlation with other major cryptocurrencies like Ethereum (0.943) and its negative correlation with gold (-0.885) suggest that it could continue to function as a mainstream digital asset.
The upcoming period will be absolutely crucial for XRP as it tests some key support levels and could also figure out its trajectory for the months ahead. For now, all eyes will remain on the $2 support level and also on whether XRP can avoid confirming the bearish head-and-shoulders pattern that could send prices significantly lower.
Also Read: Ripple: If You Put $2,000 Into XRP Now, Here’s Your Returns In 3 Years
Read More

A New Motion Filed in the Ripple-SEC Case as “Urgent”: Allegedly “Decisive Evidence”
XRP at $2.07—Will It Crash or Hit $3.78? Analyst Predicts Next Move!

The XRP price prediction has become a spicy topic right now as the crypto token hovers around the value of $2.07, with some traders and investors closely watching its next potential move. At the time of writing this piece, XRP is showing signs of a possible head-and-shoulders pattern. This could points towards either a bullish breakthrough or a significant downtrend ready to hit, depending on whether key support levels hold up.

Also Read: Dogecoin to Hit a New High? Analyst Says It’s Possible Despite Headlines
How Market Volatility and Ripple’s Technical Analysis Could Affect XRP’s Future Price

The cryptocurrency market latest batch of volatility has been particularly evident in XRP’s latest and greatest price ups and downs. Currently trading at around $2.03, XRP has experienced about a 4.66% decrease in the last 24 hours. This decline comes amid some expanding market uncertainty, with the total cryptocurrency market capitalization falling by 2.20% to $2.68 trillion.
Head-and-Shoulders Pattern Points to Potential Downturn
Don't shoot the messenger.
— Peter Brandt (@PeterLBrandt) March 28, 2025
Your favorite Beanie Baby/Pet Rock crypto displays a classic complex H&S top. This could become bullish if 3.0 is exceeded, otherwise the implications is a decline to 1.07. If you have an issue with this, take it up with Magee and Edwards $XRP pic.twitter.com/nHaIgn8uP4
According to veteran analyst and trader Peter Brandt, XRP is exhibiting a classic head-and-shoulders topping pattern that could signal trouble ahead.
“XRP bears chalk out a H&S pattern,” says Brandt. “This could become bullish if 3.0 is exceeded, otherwise the implications is a decline to 1.07.”
The head-and-shoulders pattern appearing right now is made of three chart peaks, with the middle one (the “head“) being at the highest level, while the two outer peaks (the “shoulders“) are somewhat lower. A breakdown below the pattern’s neckline around the $1.90-$2.00 range could also trigger some significant sell-offs.
Technical Indicators Show Mixed Signals

XRP’s technical indicators are currently painting a somewhat bearish picture. The cryptocurrency’s 50-day Simple Moving Average (SMA) stands at $2.38, while its 14-day Relative Strength Index (RSI) is at 43.27, indicating neutral momentum that could shift in either direction.
Also Read: Pi Network: PI Coin Price Prediction For Mid-April 2025
Price Targets: Bullish vs. Bearish Scenarios

Despite the downtrend hitting it right now, some analysts remain optimistic about XRP’s future price. Per CoinCodex, XRP could actually reach $3.78 by April 28, 2025, representing a 76.42% increase in value from the current prices.
That said, if the head-and-shoulders pattern also plays out as Brandt and others suggest, XRP could be forced to deal with a substantial decline to around $1.07 in value. This bearish scenario would be triggered if XRP breaks below the critical support zone near $2.
“A breakdown could signal a shift from a bullish to a bearish trend, potentially halving the price to $1.07,” explains Omkar Godbole, a cryptocurrency market analyst. “Bulls need to push XRP above $3 to overcome the lower high set in early March.”
Market Factors Influencing XRP’s Price Movement

There are and will always be some several external factors are currently weighing on XRP’s performance. The “tariffs-led risk-off” environment has put pressure on payments-focused cryptocurrencies like XRP. Additionally, the broader market sentiment has been impacted by recent macroeconomic developments.
The cryptocurrency is also facing some resistance at around $3 in value, a level that also marked a lower high created in early March. For XRP to resume its upward trajectory, bulls would need to overcome this resistance level decisively.
Also Read: Dogecoin Price Reversal Ahead? Analyst Predicts 129% Surge to $0.39
Long-Term Outlook Remains Positive Despite Short-Term Concerns

Looking beyond the immediate technical analysis, long-term predictions for XRP remain relatively positive. By 2030, some forecasts suggest XRP could reach as high as $6.11, although this would involve navigating through several market cycles.
Despite some short-term bearish signals, XRP’s strong correlation with other major cryptocurrencies like Ethereum (0.943) and its negative correlation with gold (-0.885) suggest that it could continue to function as a mainstream digital asset.
The upcoming period will be absolutely crucial for XRP as it tests some key support levels and could also figure out its trajectory for the months ahead. For now, all eyes will remain on the $2 support level and also on whether XRP can avoid confirming the bearish head-and-shoulders pattern that could send prices significantly lower.
Also Read: Ripple: If You Put $2,000 Into XRP Now, Here’s Your Returns In 3 Years
Read More

