


Ripple Price Analysis: Will XRP Plummet Below $2 This Week?
XRP continues to consolidate with low volatility across its BTC and USDT pairs. Price action is tight, holding above major support but struggling to gain bullish momentum.
By Edris Derakhshi
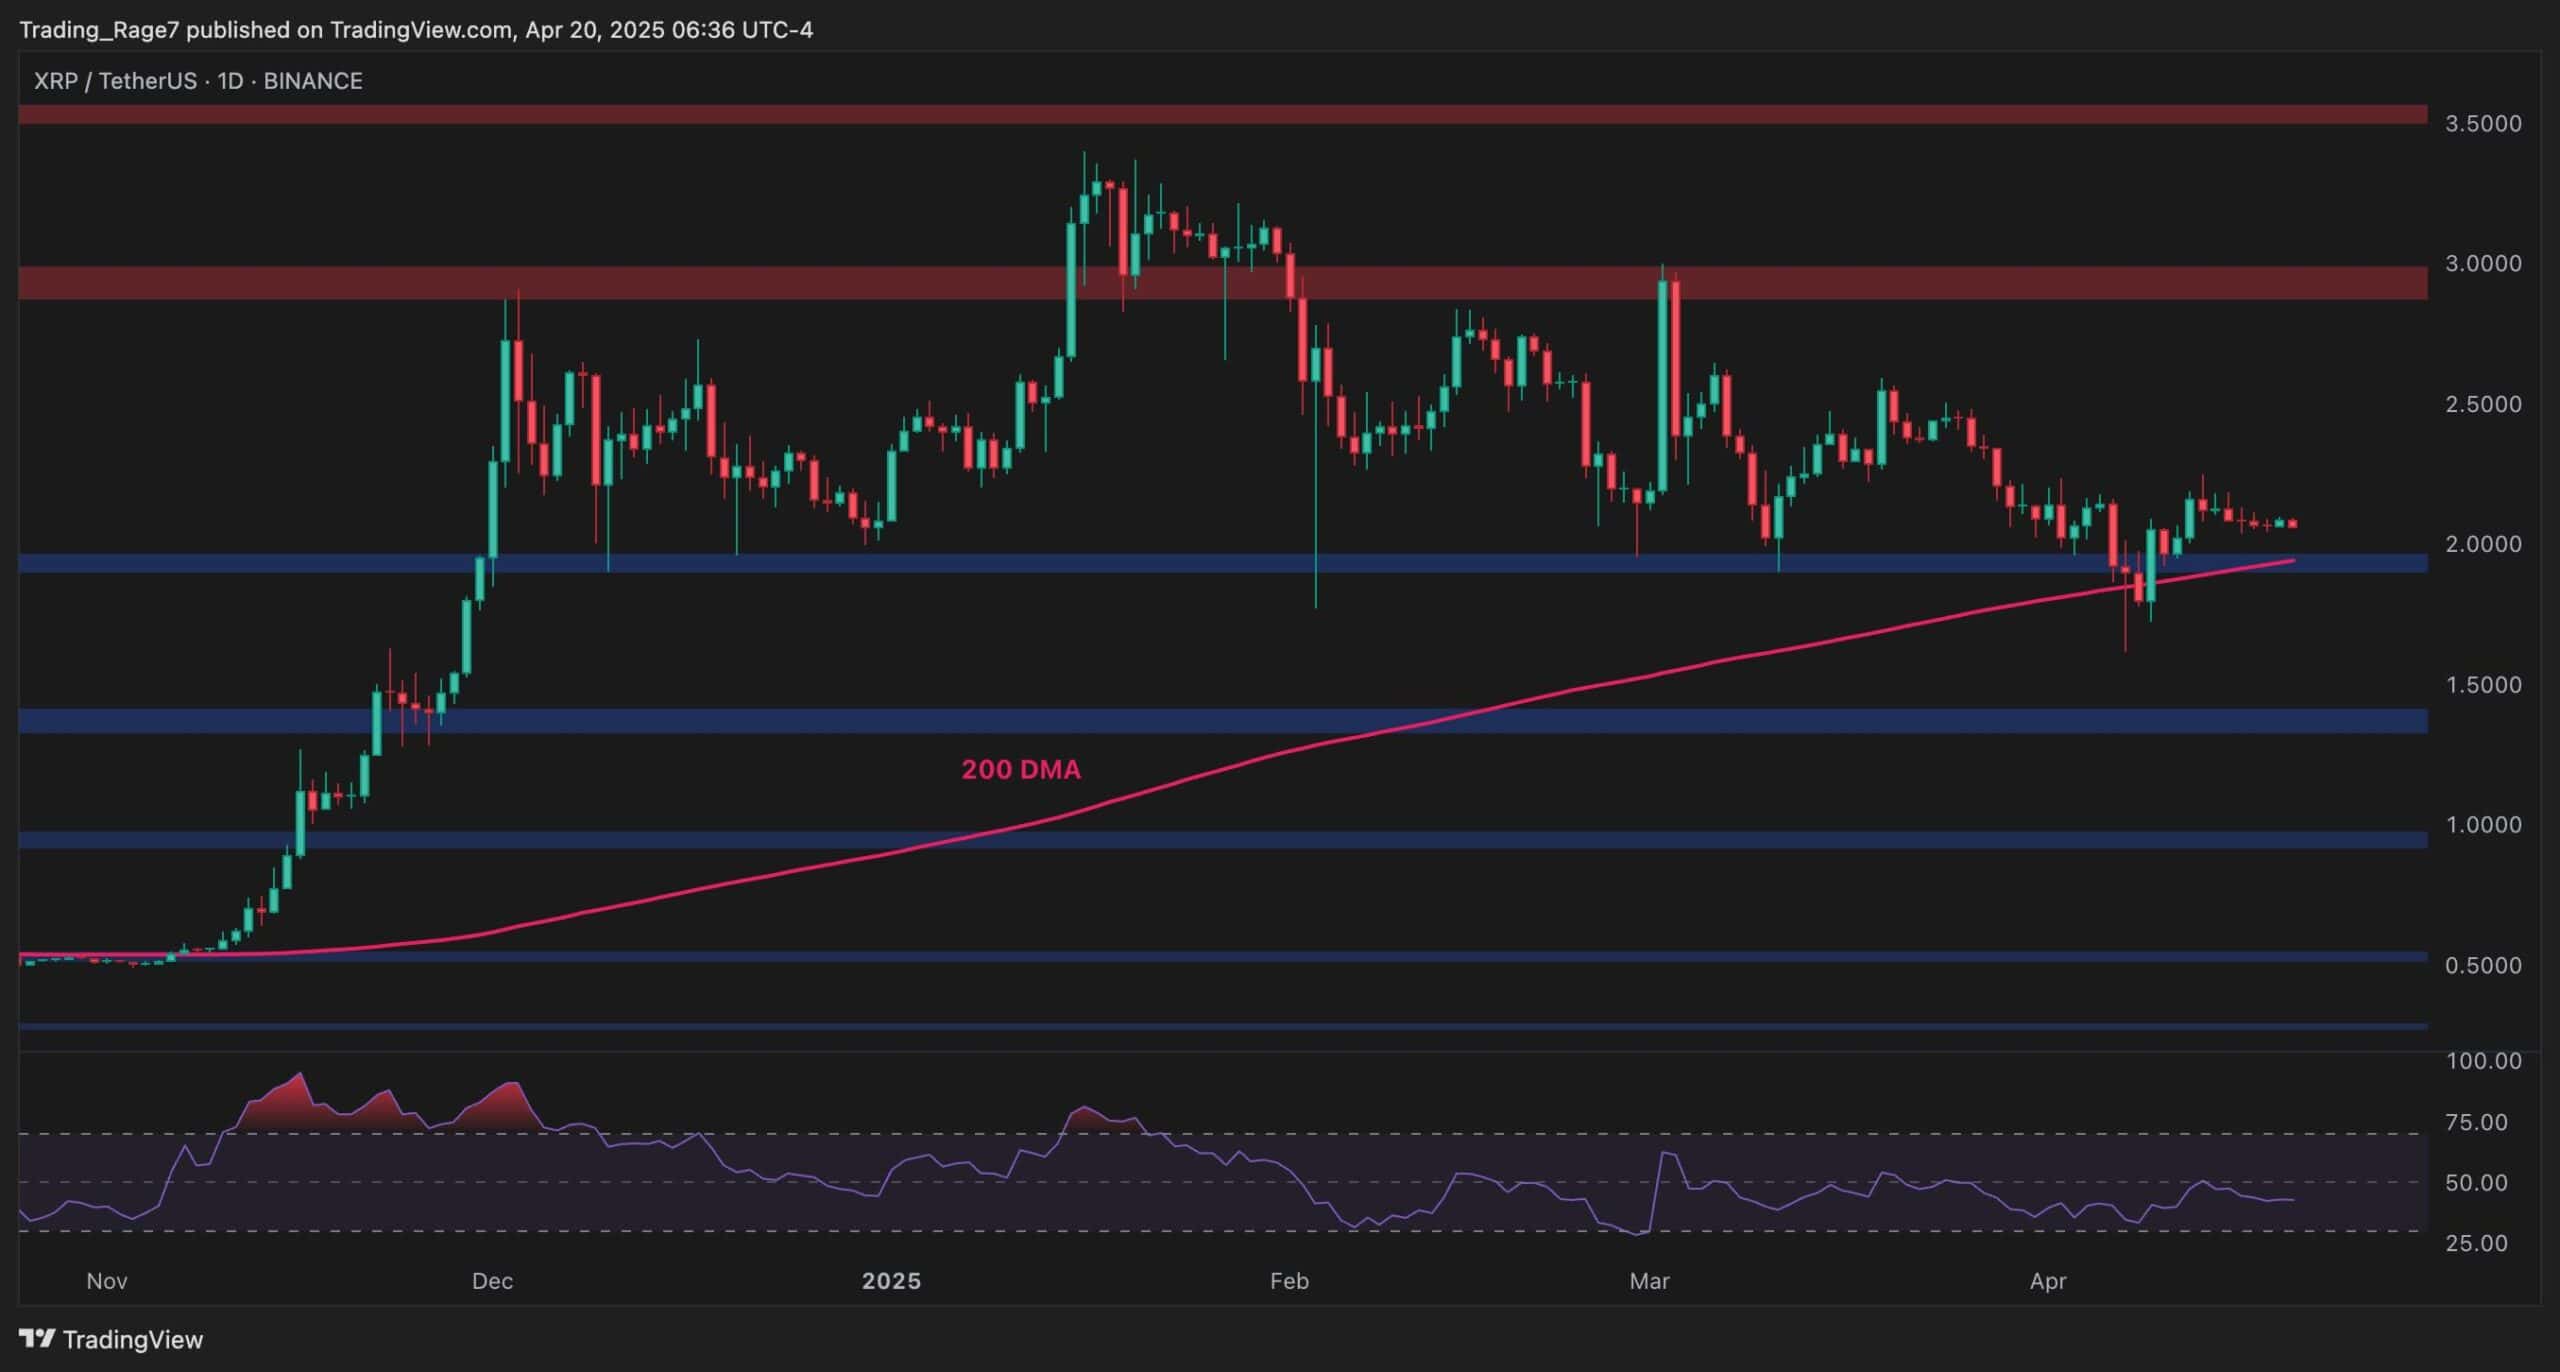
XRP Price Analysis: The USDT Chart
XRP is holding just above the $2.00 support zone and the 200-day moving average, located around the same price mark.
The $2.00 level has acted as key demand throughout April, with multiple wicks into that zone being bought up quickly. However, bullish follow-through has been weak, and the price remains compressed between $2.00 and the $2.40–$2.60 resistance zone.
Momentum is neutral as the RSI hovers around the 50 mark. Bulls need to reclaim $2.60 to confirm strength and open the way toward the $3.00–$3.10 resistance. If the 200 DMA fails to hold, the next major supports are at $1.40 and $1.
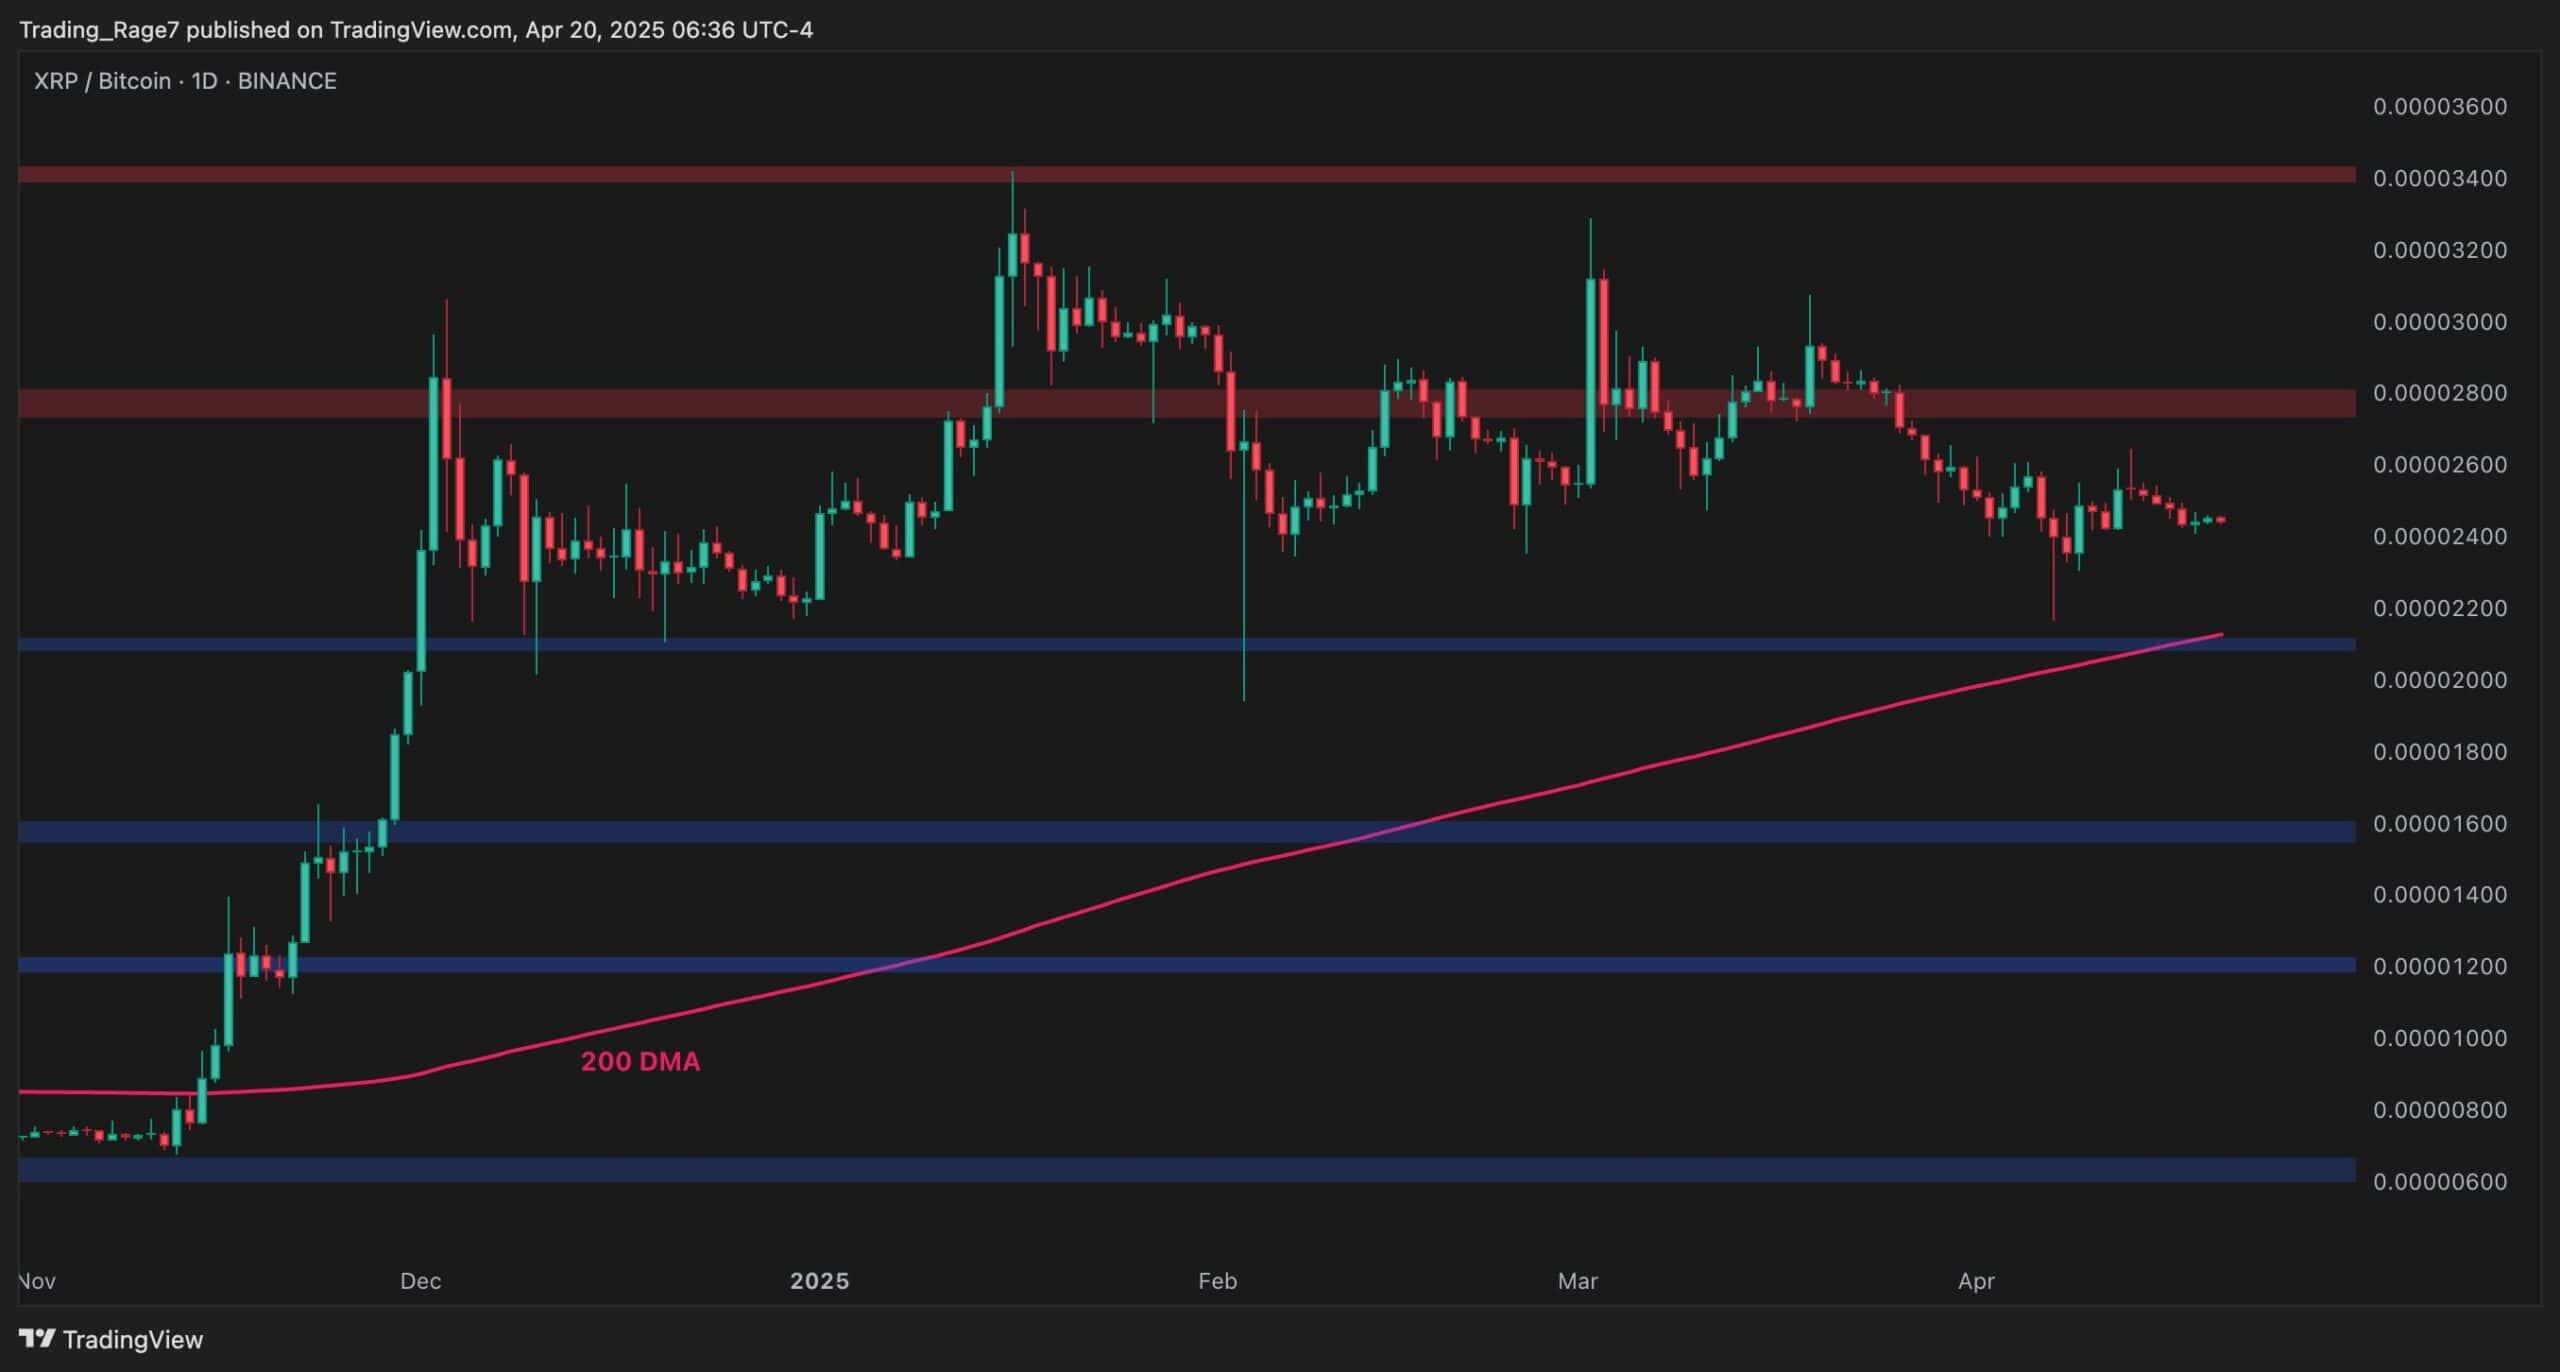
XRP Price Analysis: The BTC Paired Chart
XRP is still in a downtrend against BTC, with a clear sequence of lower highs since the peak in January. The price is now just above the 2,400 SAT level but well below the 2,800 SAT resistance zone.
The 200 DMA near 2,100 remains a key level to watch if the decline continues.
This pair continues to show relative weakness, and reclaiming 2,800 SAT is critical to shift the short-term trend. As long as XRP/BTC fails to break above that structure, upside will likely remain capped.
The post Ripple Price Analysis: Will XRP Plummet Below $2 This Week? appeared first on CryptoPotato.
Read More


Ripple Price Alert: Calm Before The Storm as XRP Prepares for Massive Move?
Ripple Price Analysis: Will XRP Plummet Below $2 This Week?
XRP continues to consolidate with low volatility across its BTC and USDT pairs. Price action is tight, holding above major support but struggling to gain bullish momentum.
By Edris Derakhshi
XRP Price Analysis: The USDT Chart
XRP is holding just above the $2.00 support zone and the 200-day moving average, located around the same price mark.
The $2.00 level has acted as key demand throughout April, with multiple wicks into that zone being bought up quickly. However, bullish follow-through has been weak, and the price remains compressed between $2.00 and the $2.40–$2.60 resistance zone.
Momentum is neutral as the RSI hovers around the 50 mark. Bulls need to reclaim $2.60 to confirm strength and open the way toward the $3.00–$3.10 resistance. If the 200 DMA fails to hold, the next major supports are at $1.40 and $1.
XRP Price Analysis: The BTC Paired Chart
XRP is still in a downtrend against BTC, with a clear sequence of lower highs since the peak in January. The price is now just above the 2,400 SAT level but well below the 2,800 SAT resistance zone.
The 200 DMA near 2,100 remains a key level to watch if the decline continues.
This pair continues to show relative weakness, and reclaiming 2,800 SAT is critical to shift the short-term trend. As long as XRP/BTC fails to break above that structure, upside will likely remain capped.
The post Ripple Price Analysis: Will XRP Plummet Below $2 This Week? appeared first on CryptoPotato.
Read More