


Bitcoin Returns Above $100,000 As Monthly Inflows Hit $80 Billion

Bitcoin has returned back above the $100,000 mark as on-chain data shows capital continues to flow into the asset at a rapid rate.
Bitcoin Realized Cap Has Crossed The $768 Billion Milestone
In a new post on X, CryptoQuant founder and CEO Ki Young Ju has discussed about the latest trend in the Realized Cap of Bitcoin. The “Realized Cap” here refers to an on-chain capitalization model that calculates BTC’s total value by assuming the value of each individual token is equal to the price at which it was last transacted on the network.
The previous transfer of any coin is likely to correspond to the last point at which it changed hands, so the price at its time could be considered as its current cost basis.
Since the Realized Cap sums up this value for all tokens in circulation, it essentially calculates the sum of the cost basis of the Bitcoin supply. In other words, the model measures the total amount of capital that the investors as whole have put into the cryptocurrency.
Now, here is the chart for the indicator shared by Young Ju that shows the trend in its value over the entire history of the digital asset:
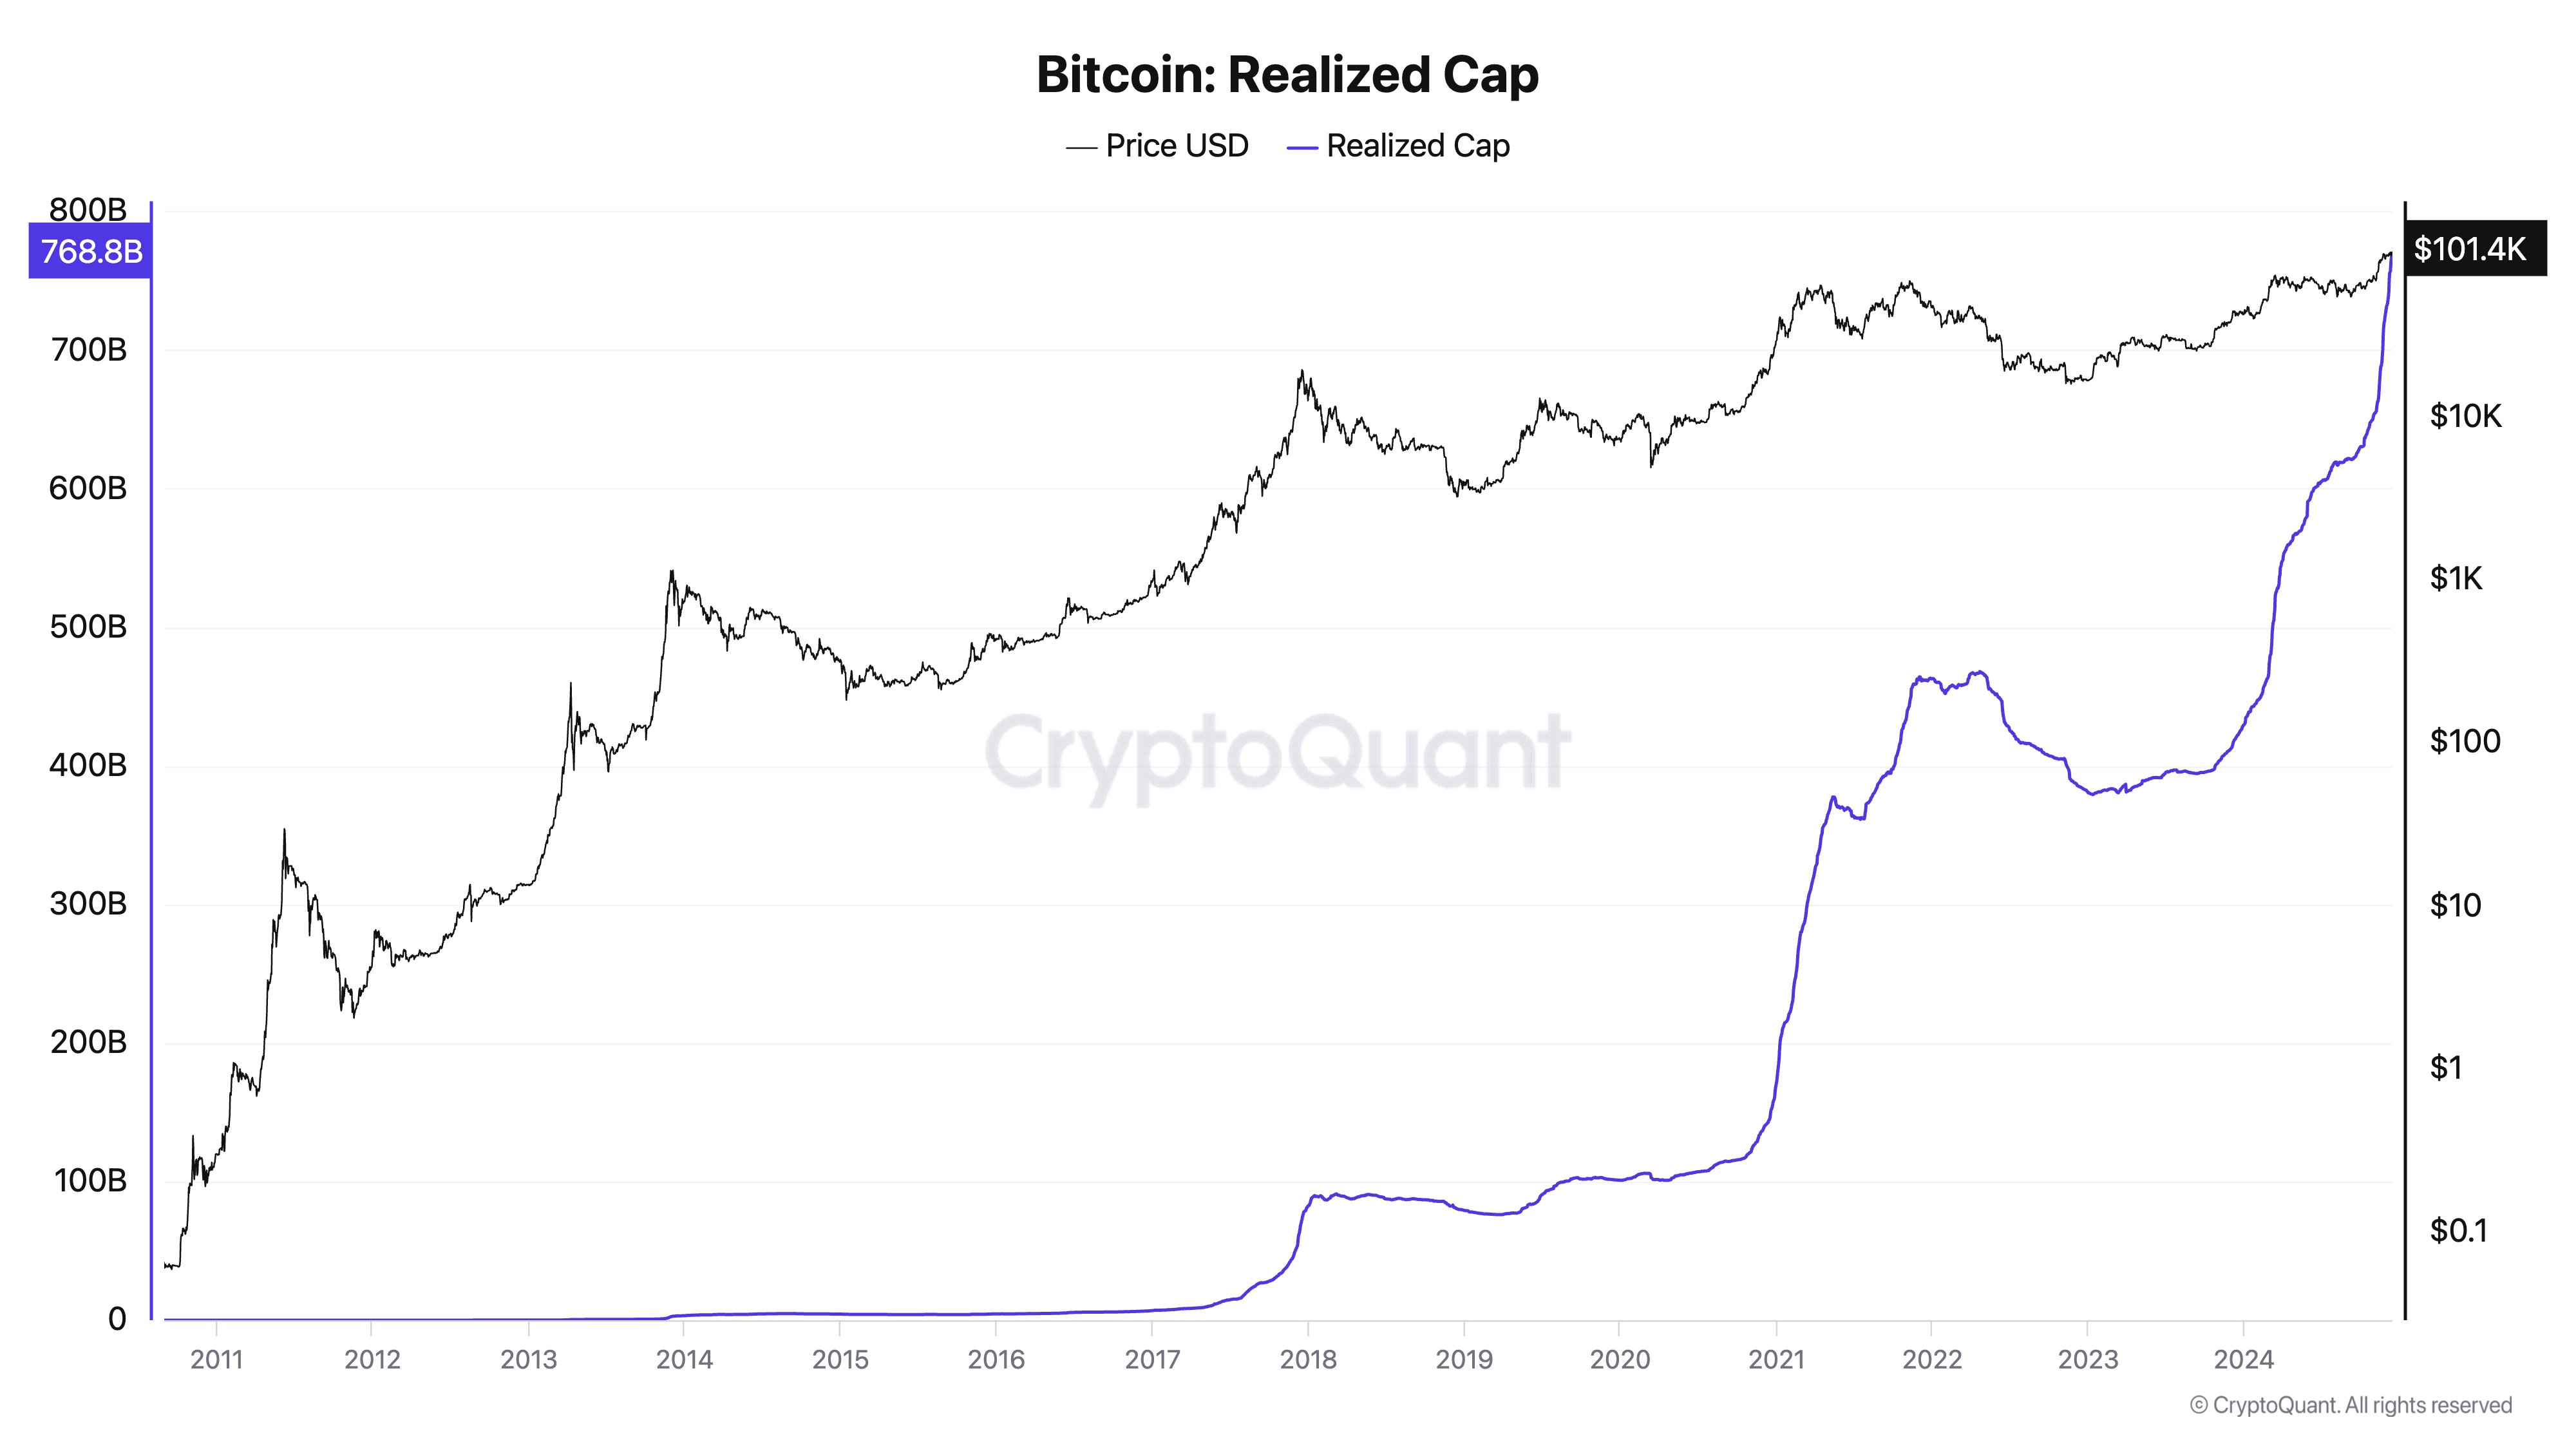
As displayed in the above graph, the BTC Realized Cap has been riding a sharp uptrend during the past year, which suggests capital has rapidly been pouring into the coin.
“Bitcoin is attracting $80 billion every month,” notes the CryptoQuant founder. “Nearly half of the capital that has entered the Bitcoin market over the past 15 years was added this year.”
Thanks to these impressive inflows, the total BTC investment has almost reached the $769 billion milestone. It’s unclear how long the Realized Cap could continue this sharp trajectory, but for now, it seems there is still plenty of demand for the asset.
In its latest weekly report, the on-chain analytics firm Glassnode has also discussed about the same metric from a different angle.

The above chart shows the cumulative data for the Bitcoin “Realized Profit” and “Realized Loss.” These metrics, as their names imply, measure the amount of profit and loss, respectively, that the investors are realizing or harvesting through their selling.
Over the history of the cryptocurrency, the difference between the cost basis and selling price for profitable transactions stands at $1.27 trillion, while that for the underwater transfers is at $592 billion.
The difference between these two metrics roughly comes out equal to the Realized Cap of Bitcoin.
BTC Price
Bitcoin has recovered back above the $100,000 level after having slipped under $95,000 earlier in the week.
Read More

Bitcoin Realized Cap Sets New Record, But Momentum Fades

Bitcoin Returns Above $100,000 As Monthly Inflows Hit $80 Billion
Bitcoin has returned back above the $100,000 mark as on-chain data shows capital continues to flow into the asset at a rapid rate.
Bitcoin Realized Cap Has Crossed The $768 Billion Milestone
In a new post on X, CryptoQuant founder and CEO Ki Young Ju has discussed about the latest trend in the Realized Cap of Bitcoin. The “Realized Cap” here refers to an on-chain capitalization model that calculates BTC’s total value by assuming the value of each individual token is equal to the price at which it was last transacted on the network.
The previous transfer of any coin is likely to correspond to the last point at which it changed hands, so the price at its time could be considered as its current cost basis.
Since the Realized Cap sums up this value for all tokens in circulation, it essentially calculates the sum of the cost basis of the Bitcoin supply. In other words, the model measures the total amount of capital that the investors as whole have put into the cryptocurrency.
Now, here is the chart for the indicator shared by Young Ju that shows the trend in its value over the entire history of the digital asset:
As displayed in the above graph, the BTC Realized Cap has been riding a sharp uptrend during the past year, which suggests capital has rapidly been pouring into the coin.
“Bitcoin is attracting $80 billion every month,” notes the CryptoQuant founder. “Nearly half of the capital that has entered the Bitcoin market over the past 15 years was added this year.”
Thanks to these impressive inflows, the total BTC investment has almost reached the $769 billion milestone. It’s unclear how long the Realized Cap could continue this sharp trajectory, but for now, it seems there is still plenty of demand for the asset.
In its latest weekly report, the on-chain analytics firm Glassnode has also discussed about the same metric from a different angle.
The above chart shows the cumulative data for the Bitcoin “Realized Profit” and “Realized Loss.” These metrics, as their names imply, measure the amount of profit and loss, respectively, that the investors are realizing or harvesting through their selling.
Over the history of the cryptocurrency, the difference between the cost basis and selling price for profitable transactions stands at $1.27 trillion, while that for the underwater transfers is at $592 billion.
The difference between these two metrics roughly comes out equal to the Realized Cap of Bitcoin.
BTC Price
Bitcoin has recovered back above the $100,000 level after having slipped under $95,000 earlier in the week.
Read More