Table of Contents
- Reasons for Bearish Sentiment
- Looking for Answers in Market Cycle Structure
- History in Three Cycles
- Zero Cycle
- First Cycle (I)
- Second Cycle (II)
- Third Cycle (III)
- Analysis of Cycle Durations and Phases
- Conclusions from Past Cycles and Their Relevance to the Current Cycle
When Will the Exponential Growth Phase Hit in the Current Cycle?


Reasons for Bearish Sentiment
The current state of the cryptocurrency market is causing genuine concern among investors, traders, bloggers, Web3 builders, and other market participants.
The altcoin market looks especially grim, with most altcoins trading even lower than they did during the depths of the previous bear market. Bitcoin has never traded for such an extended period (almost 200 days) within the range of its previous ATHs, raising concerns that we may be seeing a distribution phase within this range.
As a result, uncertainty and doubt are spreading across the community. Many are asking questions like:
-
Are we back in a bear market?
-
Will there be another altcoin bull run?
-
Could it be different this time, and will the market skip the exponential growth phase altogether?
Looking for Answers in Market Cycle Structure
To answer these questions more objectively, let’s take a look at the crypto market through the lens of “market cycles,” which are repeating global price patterns.
Bitcoin’s market cycle typically consists of a series of key events:
-
Cycle Start. The date when Bitcoin sets a new all-time high. This also marks the end of the previous cycle.
-
Cycle Bottom. The lowest price Bitcoin reaches during the cycle.
-
Halving. A non-price event, but crucial for the cycle’s structure, as it influences market sentiment and affects Bitcoin’s supply, one of the two key factors in its price formation.
-
Trend Acceleration (Expansion Point). This is the moment in the cycle when Bitcoin’s price finally breaks through the “resistance” of the previous cycle’s peak and starts to rise rapidly.
-
Cycle End. The date when Bitcoin sets a new all-time high. The new cycle starts right away.
Now, let’s define the phases of the cycle based on these key events:
-
The period between the start of the cycle and the cycle’s bottom is called the bear phase. During this phase, Bitcoin’s price typically falls by around 80% from its peak.
-
The period between the bottom and the acceleration point is referred to as the consolidation phase. This phase varies significantly from cycle to cycle and is often the most challenging for market participants due to its lack of a clear trend and high uncertainty. We’re likely in this phase now.
-
The period between the acceleration point and the cycle’s end is called the bull phase. This is when exponential price growth occurs for both Bitcoin and other cryptocurrencies. This phase is often associated with the term “altcoin season” and typically accounts for the lion’s share of the market’s growth.
History in Three Cycles
To understand where we’re now and what to expect from the current cycle, let’s take a closer look at previous ones. Note that we’ll be focusing on the timing and duration of these cycles, rather than specific price points. Our goal is not to predict the cycle’s peak, but rather to determine whether we should expect one at all, and if so, when.

Zero Cycle
Bitcoin’s zero market cycle began with the first Bitcoin trades in 2010. However, using our terminology, we can’t define the start of this cycle, as there was no previous peak to mark it. Additionally, this cycle didn’t feature a halving event, so we exclude it from our analysis and refer to it as the “zero cycle.”
First Cycle (I)
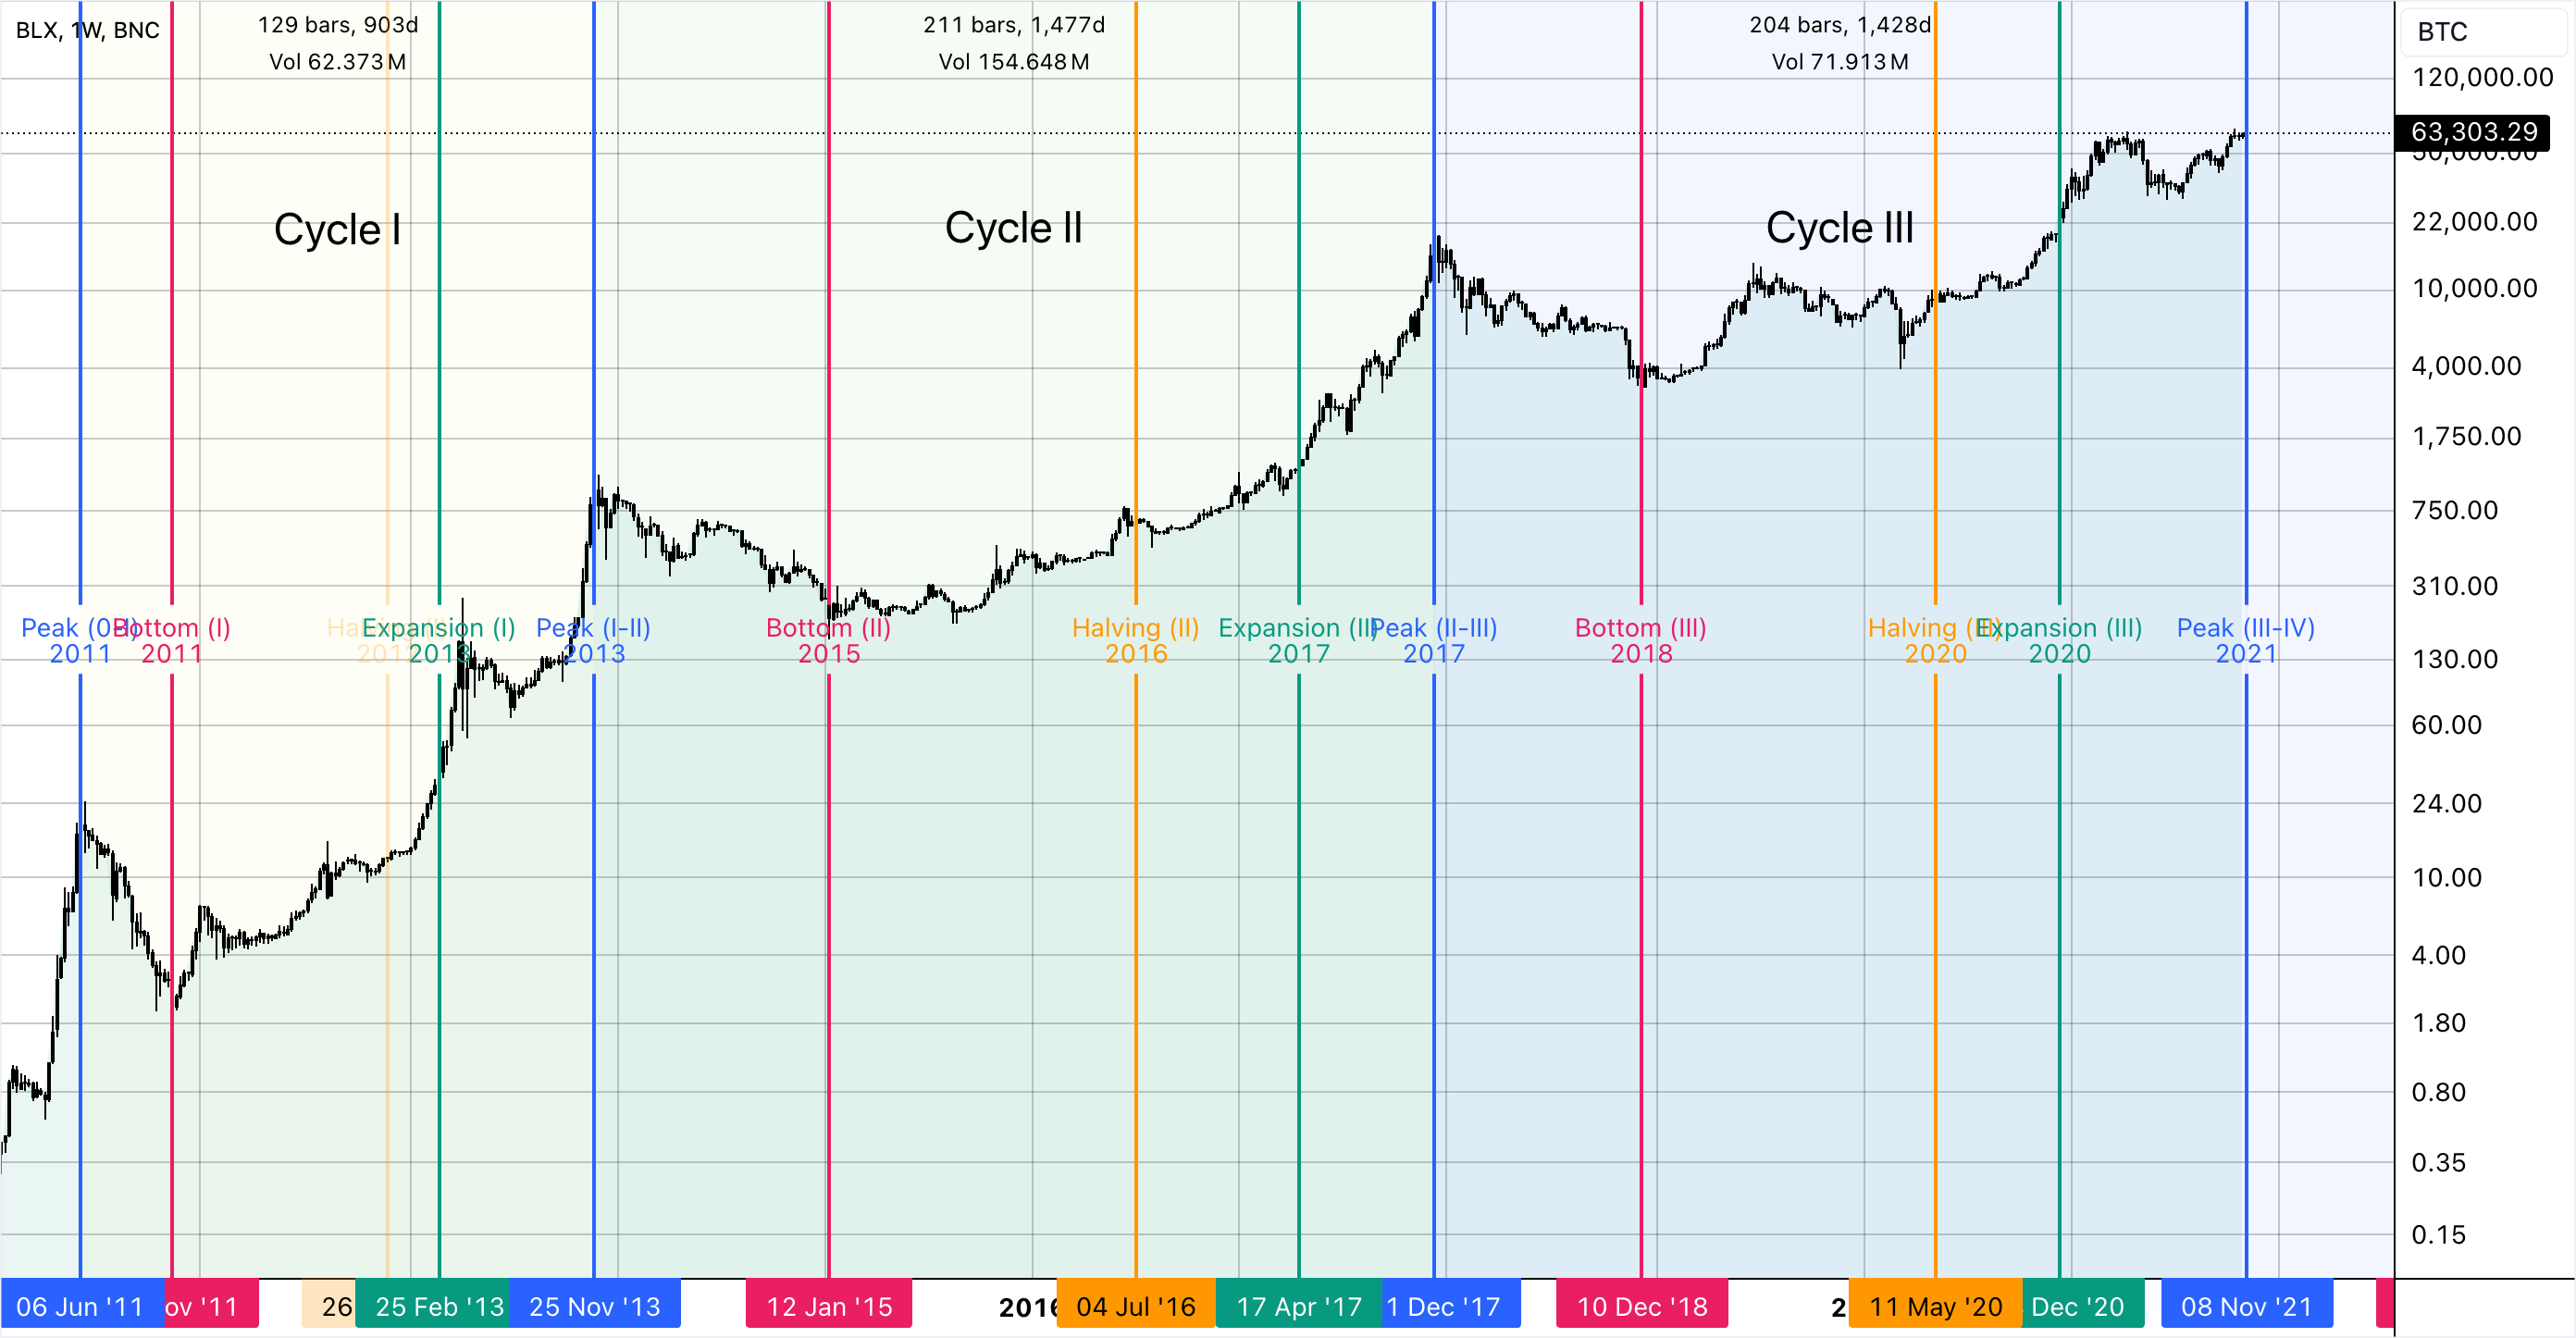
The first analyzable market cycle began on June 8, 2011, when Bitcoin hit a then-record high of $31.9.
Following this, Bitcoin’s price declined for 163 days (the bear phase) until it bottomed out at $2.01 on November 18, 2011.
On November 28, 2012, Bitcoin experienced its first-ever halving. The consolidation phase, which is the recovery period from the cycle’s bottom to the previous ATH, lasted 468 days.
The bull phase began on February 28, 2013, and lasted for 270 days, culminating on November 30, 2013, with a new all-time high of $1,177. In total, this cycle lasted 901 days (from June 8, 2011, to November 30, 2013).
Second Cycle (II)
The second cycle began at the peak of the previous cycle, at $1,177.
From there, Bitcoin’s price fell for 415 days in search of the cycle’s bottom, which was reached on January 14, 2015, at $163.88.
The consolidation phase lasted 824 days, during which Bitcoin experienced its second halving on July 9, 2016.
Finally, on April 17, 2017, Bitcoin broke through the previous all-time high, kicking off the bull phase.
This phase lasted for 244 days and ended on December 17, 2017, when Bitcoin reached a new record price of $19,764. This entire cycle lasted 1,483 days.
Third Cycle (III)
The third cycle, like the others, began at the previous peak of $19,764, followed by the bear phase lasting 363 days.
The cycle’s bottom was reached on December 15, 2018, at $3,148.
Afterward, Bitcoin entered the consolidation phase, which lasted 732 days until December 16, 2020, when the price finally broke through the previous all-time high, entering the acceleration stage.
The bull phase lasted 329 days and ended with a new record high of $68,945 on November 10, 2021.
Thus, the fourth cycle began in November 2021 and is still ongoing.
Before we move on to forecasts about the prospects of the current cycle, let’s analyze the completed cycles in terms of their time structure.
Analysis of Cycle Durations and Phases
Here’s a breakdown of the length of past cycles and their respective phases in days:
|
Cycle Phase |
First Cycle (I) |
Second Cycle (II) |
Third Cycle (III) |
|
Total cycle length (days) |
901 |
1,483 |
1,424 |
|
Bear phase (days) |
163 |
415 |
363 |
|
Consolidation phase (days) |
468 |
824 |
732 |
|
Bull phase (days) |
270 |
244 |
329 |
At first glance, this analysis doesn’t seem to give us any clear patterns, as cycles II and III are quite similar in duration and structure but significantly different from cycle I.
Furthermore, when we look at the specific days within each cycle when key events like the halving and trend acceleration occur, we also don’t see any strong correlations:
|
Event |
First Cycle (I) |
Second Cycle (II) |
Third Cycle (III) |
|
Halving |
539 |
957 |
876 |
|
Acceleration (expansion) |
631 |
1,239 |
1,095 |
However, what if we express the overall length of the cycles in percentage terms, with the total cycle length equaling 100%? Here’s what we found:
|
Cycle Phase |
First Cycle (I) |
Second Cycle (II) |
Third Cycle (III) |
Average Value |
|
Total cycle length (%) |
100% |
100% |
100% |
100% |
|
Bear phase (%) |
18% |
28% |
25% |
24% |
|
Consolidation phase (%) |
52% |
56% |
51% |
53% |
|
Bull phase (%) |
30% |
16% |
23% |
23% |
Some patterns start to emerge:
-
The consolidation phase consistently makes up about half of the overall cycle length.
-
The bear and bull phases combined account for the remaining half of the cycle.
-
On average, both the bear and bull phases individually comprise roughly a quarter of the total cycle length.
Moreover, if we look at two key events, the halving and the trend acceleration point, in percentage terms (i.e., when they occur as a percentage of the overall cycle length), an interesting picture unfolds:
|
Cycle Phase |
First Cycle (I) |
Second Cycle (II) |
Third Cycle (III) |
Average Value |
|
Halving |
60% |
65% |
62% |
62% |
|
Acceleration (expansion) |
70% |
84% |
77% |
77% |
The halving has almost always occurred around two-thirds of the way through the cycle, with an average value of 62%.
Trend acceleration, signaling the start of the bull phase, usually takes place at the beginning of the last quarter of the cycle, with an average of 77%.
Conclusions from Past Cycles and Their Relevance to the Current Cycle
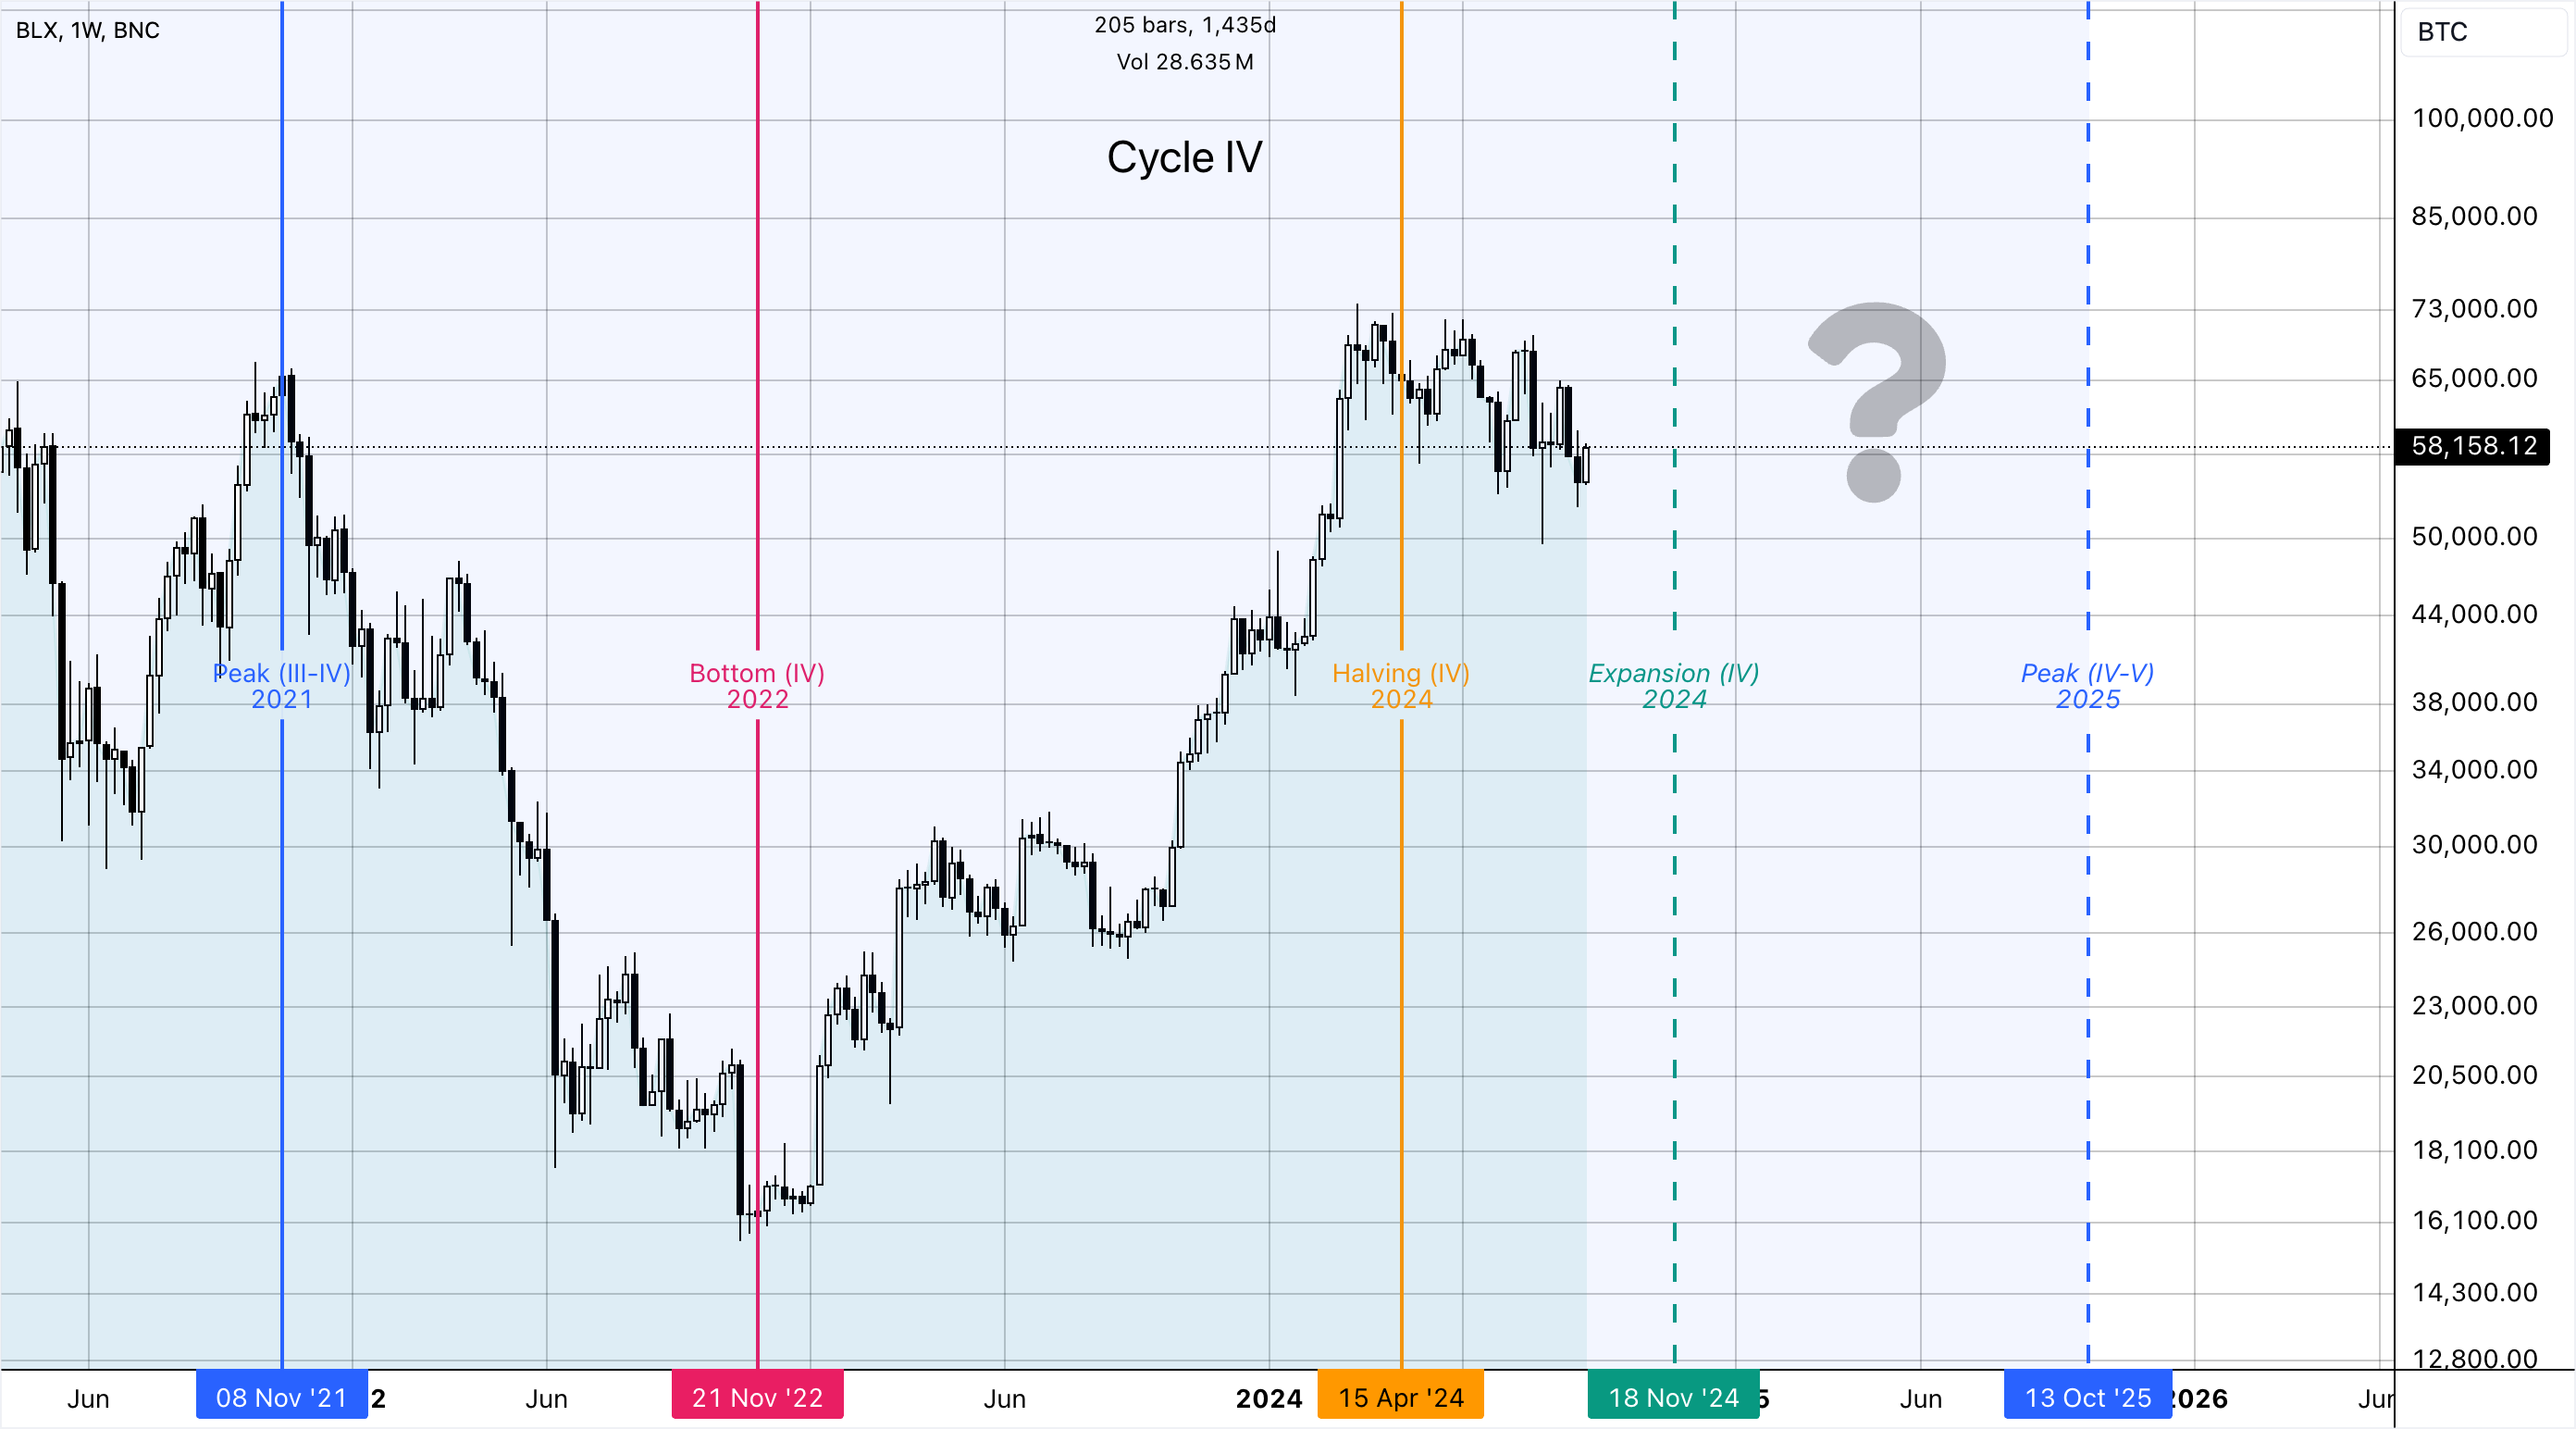
Now, knowing the start date of the current cycle (November 10, 2021), the date of the next halving (April 19, 2024), and considering that halvings on average occur at 62% of the cycle’s total length, we can estimate the approximate end date of the current cycle — October 18, 2025. In this case, the cycle would last 1,438 days, with 891 of those days passing before the halving (which is nearly exactly 62%).
Now for the most intriguing part! Using this date as the estimated cycle peak, we can also calculate the likely date for trend acceleration, or the start of the bull phase. Historically, acceleration has occurred around 77% of the total cycle length, meaning in this case (assuming a total cycle length of 1,438 days), it should happen on day 1,107 — around November 19, 2024, or roughly two months from the date of this publication.
So, based on the data from the past three cycles, we can hypothesize the following structure for the current cycle:
-
Cycle start date: November 10, 2021.
-
Bottom: November 21, 2022 — the bear phase lasted 376 days, or 26% of the total cycle length.
-
Halving: April 19, 2024 — it occurs on the 891 day of the cycle, which marks 62% of the cycle’s completion.
-
Trend acceleration: ~November 19, 2024 — it happens at 77% of the cycle’s completion.
-
Consolidation phase length (from cycle bottom to trend acceleration): 729 days, or 51% of the total cycle length.
-
New ATH (cycle end): ~October 18, 2025.
-
Bull phase length: 333 days, or 23% of the total cycle length.

This structure closely mirrors the average pattern of previous cycles: half of the cycle is spent in consolidation; the bear and bull phases last roughly a quarter of the cycle each; the halving occurs around 62% of the way through the cycle, and trend acceleration typically happens at the start of the final quarter.
Of course, things could turn out very differently, and this cycle may deviate from past trends. But at the same time, it’s not rational to bet against a continued pattern. After all, as the saying goes, “the trend is your friend until it ends.” The goal of this analysis wasn’t to spark hope that “the best is yet to come,” but rather to take an impartial look at the current situation based on Bitcoin’s past market cycles.
Disclaimer: This post was independently created by the author(s) for general informational purposes and does not necessarily reflect the views of ChainRank Analytics OÜ. The author(s) may hold cryptocurrencies mentioned in this report. This post is not investment advice. Conduct your own research and consult an independent financial, tax, or legal advisor before making any investment decisions. The information here does not constitute an offer or solicitation to buy or sell any financial instrument or participate in any trading strategy. Past performance is no guarantee of future results. Without the prior written consent of CryptoRank, no part of this report may be copied, photocopied, reproduced or redistributed in any form or by any means.
Table of Contents
- Reasons for Bearish Sentiment
- Looking for Answers in Market Cycle Structure
- History in Three Cycles
- Zero Cycle
- First Cycle (I)
- Second Cycle (II)
- Third Cycle (III)
- Analysis of Cycle Durations and Phases
- Conclusions from Past Cycles and Their Relevance to the Current Cycle